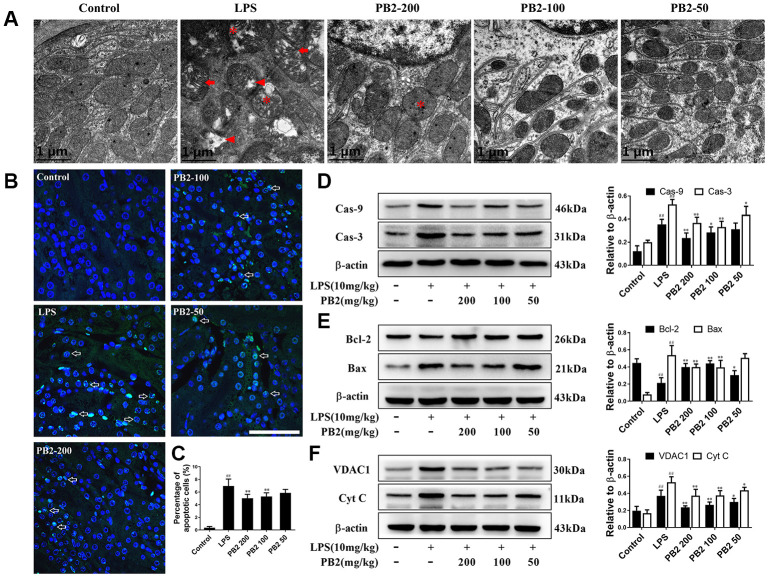
Figure 2.
Effects of PB2 on mitochondrial structure and mitochondrial-mediated apoptosis (n = 8). Mitochondrial structure in renal tubular epithelial (Bar = 1 μm) (A); TUNEL staining (Bar = 50 μm, green fluorescent spots) (B), and percentage of TUNEL-positive cells (C); expressions of caspases, Bcl-2, Bax, VDAC1, Cyt c and the semi-quantification (D–F). #P ≤ 0.05, ##P ≤ 0.01 compared to control mice; *P ≤ 0.05, **P ≤ 0.01 compared to LPS challenged alone.

