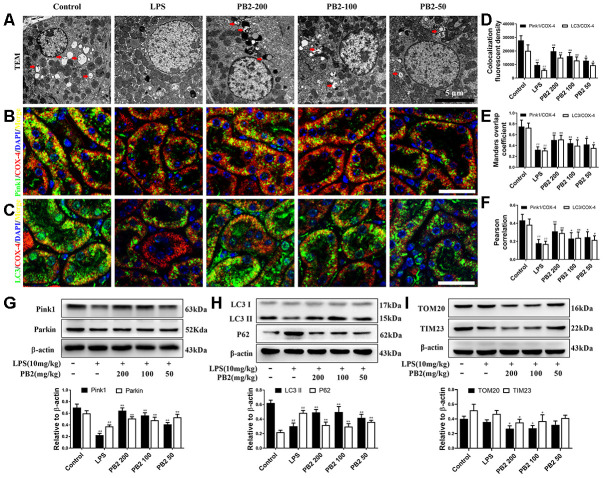
Figure 4.
Effects of PB2 on mitophagy (n = 8). Mitochondrial structure in renal tubular epithelial (Bar = 5 μm) (A); co-localization of anti-LC3 (green)/anti-COX IV (red) antibodies (B) and anti-Pink1 (green)/anti-COX IV (red) antibodies (C) (Bar = 25 μm); the co-localization fluorescence intensity, overlap coefficient and Pearson's correlation of LC3-COX IV and Pink1-COX IV (D–F); expression of Pink1, parking, LC3 and p62, and semi-quantification (G–I). #P ≤ 0.05, ##P ≤ 0.01 compared to control mice; *P ≤ 0.05, **P ≤ 0.01 compared to LPS challenged alone.

