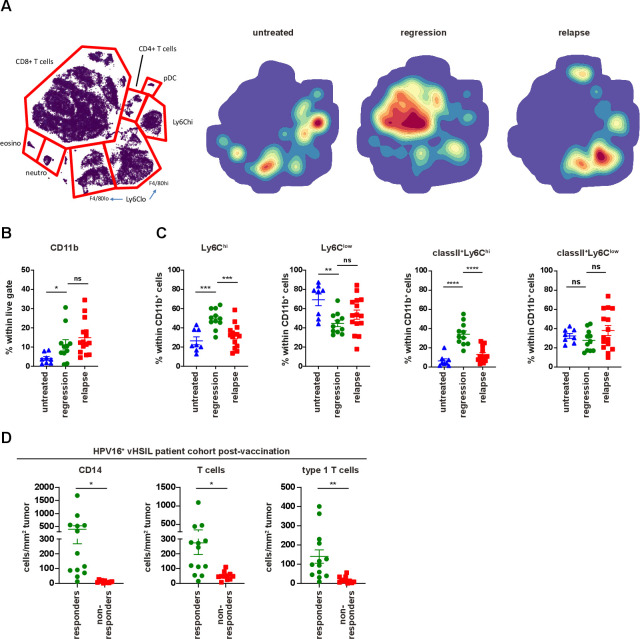
Figure 3.
Response to vaccine is correlated with infiltration of inflammatory myeloid cells. Mice were injected with TC-1 tumor cells on day 0. Then, mice were vaccinated with prime SLP suboptimal vaccine on day 8 (regressed) or kept untreated (untreated) and were sacrificed on day 18. Another group of mice vaccinated with prime and boost SLP suboptimal vaccine on day 8 and 22 were sacrificed at the time of relapse on day 39 (relapsed). (A) H-SNE plots of total CD45+ immune infiltrates of TC-1 tumors of untreated, regressed or relapsed. Tumors were analyzed by mass cytometry followed by non-supervised clustering using Cytosplore as described in materials and methods. The relative contribution of major myeloid and lymphoid cell types is indicated in the H-SNE plot, as indicated. (B) The percentage of CD11b+ within live gate. (C) The percentage of Ly6Chi and Ly6Clow cells as well as classII+Ly6Chi and classII+Ly6Clow within CD11b+ cells on day 18 at the time of regression (regression) or at the time of relapse on day 39 (relapse). The scheme is shown in online supplementary file 7A. (D) Immune microenvironment of vHSIL patients 3 months after therapeutic vaccination by HPV16 SLP, separated for responders (n=13) and non-responders (n=11). Depicted are the number of infiltrating CD14+ macrophages (CD14+CD68-/+CD163-/+), CD3+ T cells (CD3+CD8-/+Foxp3-) and type one cytokine producing (Tbet+) T cells (CD3+CD8-/+Foxp3-Tbet+) per mm2 tumor post vaccination. data presented are mean±SEM, and statistical analysis was performed using unpaired t-test. *P<0.05; **P<0.01; ***P<0.001; ****P<0.0001. ns, not significant; vHSIL, vulvar high-grade squamous intraepithelial lesions.

