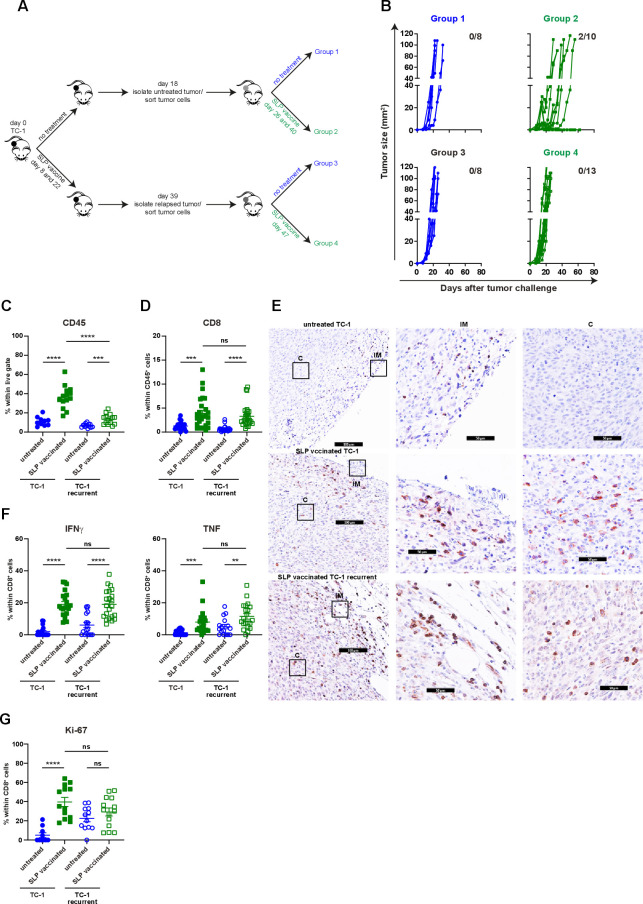
Figure 4.
Non-Curative immunotherapy drives the development of immune resistant tumors. (A) Scheme of the experimental procedure. In brief, mice were injected with TC-1 tumor cells on day 0. Then, mice were suboptimal vaccinated with SLP vaccine on days 8 and 22 or kept untreated. Untreated mice were sacrificed on day 18. Tumor cells were sorted and injected back into naïve mice. these mice received suboptimal vaccination on days 26 and 40 or kept untreated. Similarly, suboptimal vaccinated mice were sacrificed on day 39, tumor cells were sorted and injected back into naïve mice, which were suboptimal vaccinated on days 47 or left untreated. (B) Tumor outgrowth of the mice shown in (A). The number of tumor-free mice from total is indicated. Data are pooled of two experiments. (C–G) The scheme of the experiment is shown in (A). The mice (group 1–4) were sacrificed on day 15 post tumor challenge. (C) The percentage of CD45+ cells within live gate in the tumor microenvironment. (D) The percentage of intratumoral CD8+ T cells within CD45+ cells. (E) The representative immunohistochemistry images of CD3+ T cells in tumors of untreated TC-1, suboptimal SLP-vaccinated TC-1 and suboptimal SLP-vaccinated TC-1 recurrent tumor-bearing mice (C: center, IM: invasion margin). (F) IFNγ and TNF production of intratumoral CD8+ T cells. (G) The percentage of Ki67+ intratumoral CD8+ T cells. data presented in C, D, F and G are mean±SEM, and statistical analysis was performed using unpaired t-test. **P<0.01; ***P<0.001; ****P<0.0001. IFNγ, interferon-γ; ns, not significant; TNF, tumor necrosis factor.

