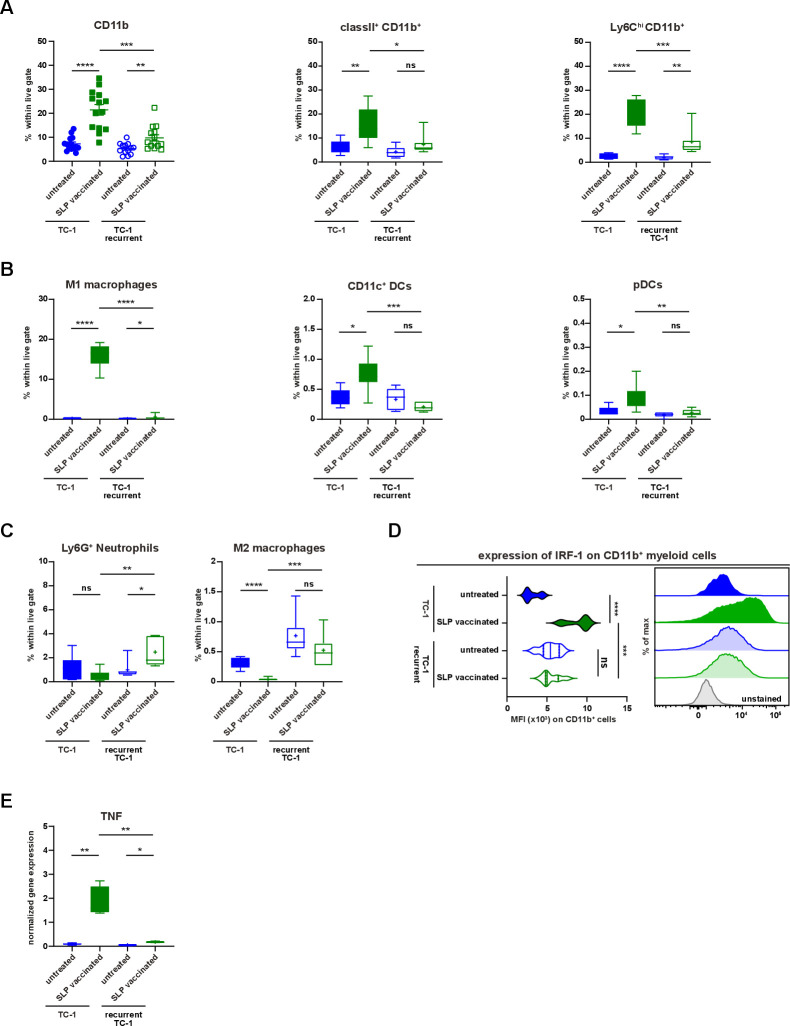
Figure 5.
Recurrent tumors display impaired inflammatory myeloid cell infiltration. (A–E) The scheme of the experiment is shown in figure 4A. The mice (group 1–4) were sacrificed on day 15 post-tumor challenge. (A) The percentage of CD11b+, classII+CD11b+ and Ly6ChiCD11b+ cells within live gate in the tumor microenvironment of untreated and suboptimal SLP-vaccinated TC-1 and TC-1 recurrent tumor-bearing mice. (B) The percentage of M1-type macrophages, CD11c+ DCs and pDCs within live gate. (C) The percentage of intratumoral Ly6G+ neutrophils and M2-type macrophages within live gate. (D) The expression level of IRF-1 on intratumoral CD11b+ myeloid cells. The representative histogram is shown on the right. (E) The normalized gene expression level of TNF in the tumor microenvironment of untreated and SLP-vaccinated TC-1 and TC-1 recurrent tumor-bearing mice. Data presented are mean±SEM in the scatter plot and min to max (mean shown as +) in box and whiskers plots. Statistical analysis was performed using unpaired t-test. *P<0.05; **P<0.01; ***P<0.001; ****P<0.0001. ns, not significant; TNF, tumor necrosis factor.

