Figure 4.

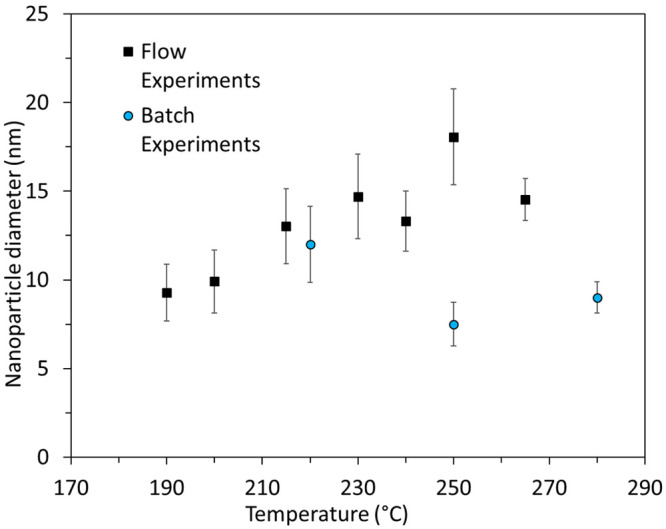
Nanoparticle diameters obtained as a function of reaction temperature for both flow and batch experiments. The standard deviation of the mean diameter is plotted as error bars.

Nanoparticle diameters obtained as a function of reaction temperature for both flow and batch experiments. The standard deviation of the mean diameter is plotted as error bars.