
Figure 4.
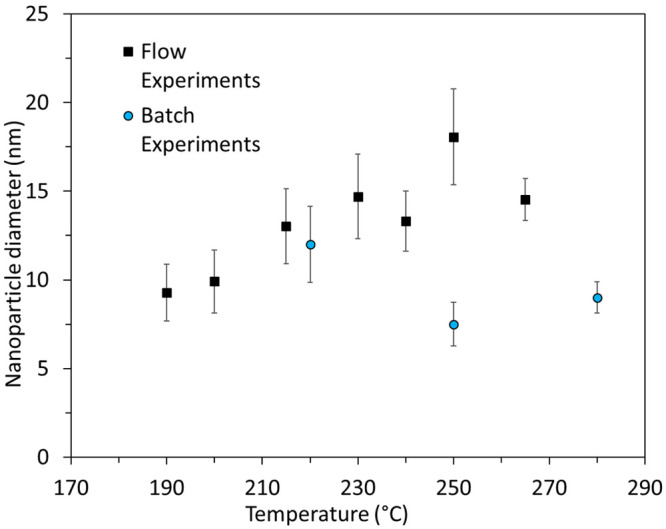
Nanoparticle diameters obtained as a function of reaction temperature for both flow and batch experiments. The standard deviation of the mean diameter is plotted as error bars.
Official websites use .gov
A
.gov website belongs to an official
government organization in the United States.
Secure .gov websites use HTTPS
A lock (
) or https:// means you've safely
connected to the .gov website. Share sensitive
information only on official, secure websites.
Nanoparticle diameters obtained as a function of reaction temperature for both flow and batch experiments. The standard deviation of the mean diameter is plotted as error bars.