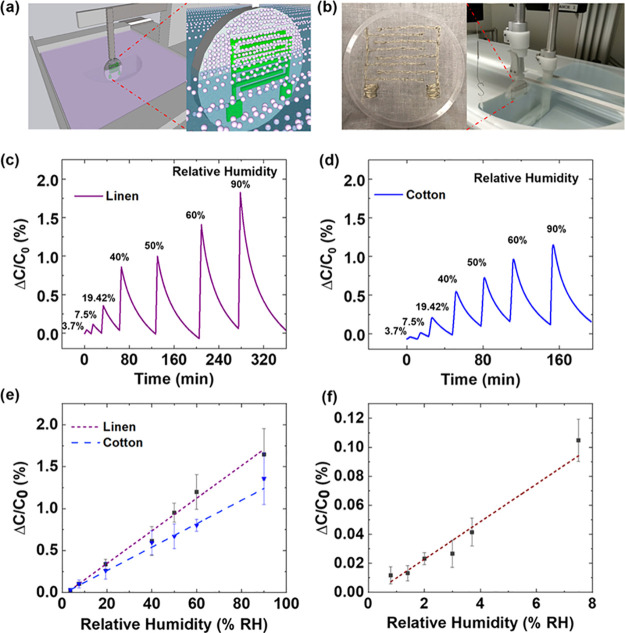
Figure 1.
(a, b) Scheme and photograph of the setup used for Langmuir–Blodgett (LB) deposition. (c, d) Response curve of the linen and cotton TEX sensors in the presence of humidity from 3.7 to 90%. (e) Comparison of the linen and cotton TEX sensor responsivities. Both types of sensors showed a linear response. (f) Calibration curve of the linen TEX sensor in the low-relative-humidity range (from 0.71 to 7.5%). Error bars correspond to the standard deviation from the measurement of three different samples. Relative humidity was measured at 22 °C.

