Figure 4.
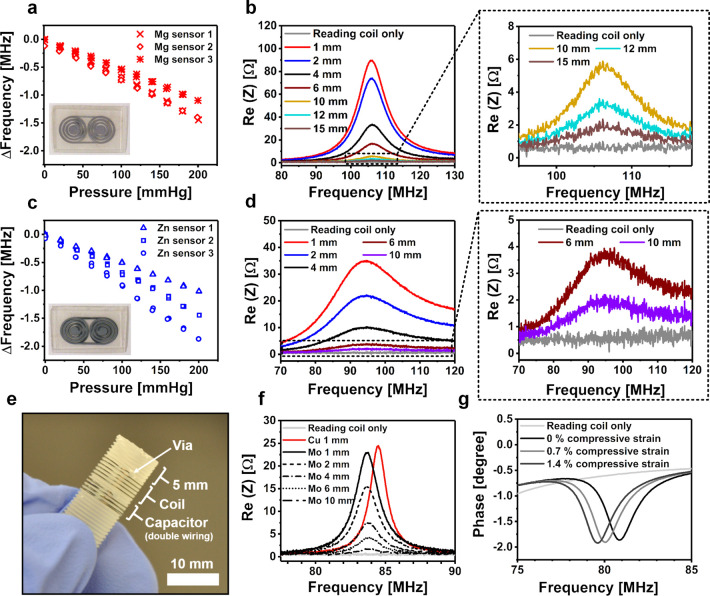
(a) Pressure responses of the bioresorbable Mg pressure sensors, as measured through a glass bottle from a reading distance of 6 mm. A photograph of the sensor is shown in the inset. (b) Graphs of the impedance spectrum measured by increasing the reading distance of the Mg sensor, including rescaled graphs of the largest reading distances (on the right). The testing was performed by stacking 1 mm thick microscopy slides one by one between the sensor and the reader coil to stepwise increase the reading distance. (c, d) Corresponding Zn pressure sensor data. (e) Structure of the Mo wire compression sensor with a solenoidal coil. (f) Impedance spectrum graphs of the Mo compression resonance sensor with an increasing reading distance, including a reference measurement using a similar sensor made from Cu wire. In our measurement setup, the tip of the polymer screw adds another 5 mm to the indicated distance between the sensor coil and the reading coil. (g) Impedance phase graphs at various axial compressive strains, showing a decrease in the resonance frequency as estimated from the minimum value of the phase.

