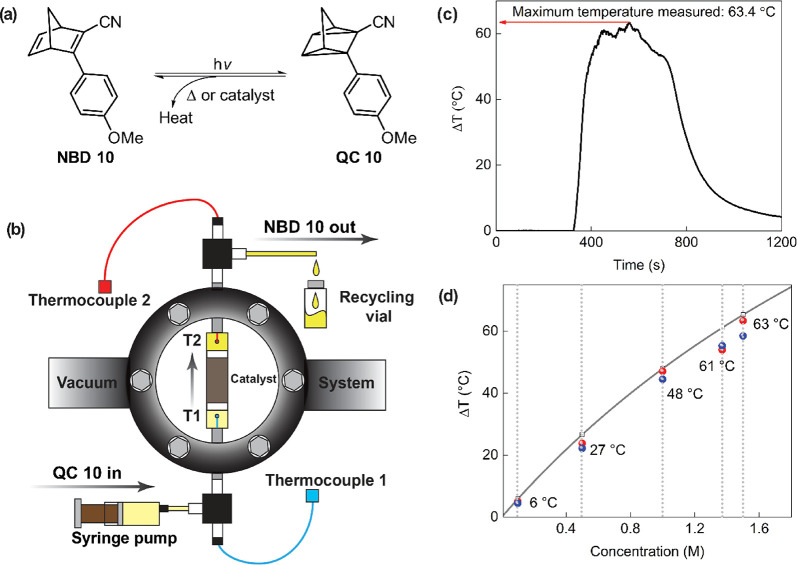
Figure 8.
(a) Photoisomerization reaction of NBD 10 to QC 10. (b) Illustration of the vacuum chamber. The temperature was measured by thermocouples before (Thermocouple 1) and after the catalytic center (Thermocouple 2). (c) Heat release thermogram of a 1.5 M toluene solution of QC 10 showing the highest temperature gradient of 63.4 °C. (d) Graph of heat release vs concentration, where the theoretical simulation is the gray line and the experimental data are the red and blue dots.3 Adapted with permission from ref (3). Copyright 2019 Royal Society of Chemistry.

