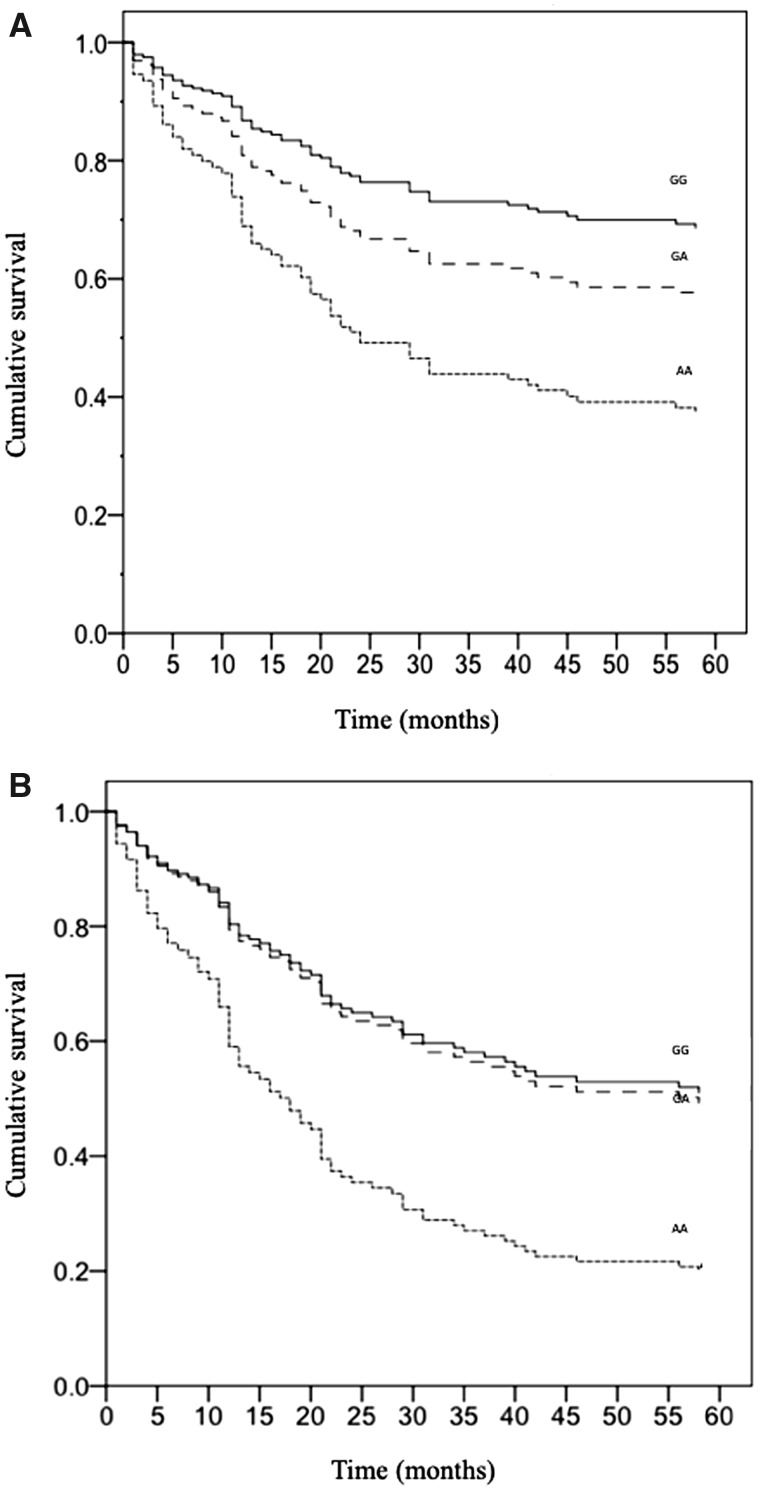
FIGURE 4.
Cox regression analysis of CV events during the 5-year FU in (A) the entire population of 245 patients [OR 3.3 (95% CI 1.4–7.7), P = 0.006] and in (B) 161 hemodialysis patients with a previous history of CV events divided according to their genotype at GLP1R rs10305445 (G > A) [AA patients: OR 2.4 (95% CI 1–5.6), P = 0.043; GA patients: OR 1.1 (95% CI 0.6–1.8), P = 0.86; GG as the reference group].

