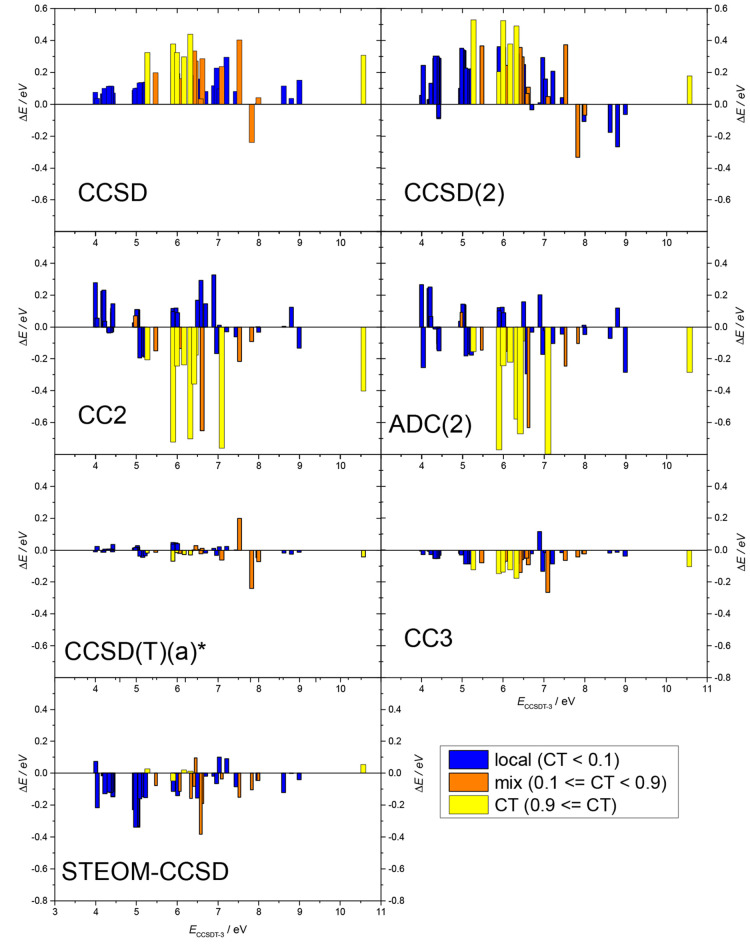
Figure 3.
Error of the calculated excitation energy (ΔE) with respect to CCSDT-3 as the function of the CCSDT-3 excitation energy (ECCSDT–3). The colors of the bar show the character of the respective excited state: blue for local states (ωCT < 0.1), yellow for CT states (ωCT ≥ 0.9), and orange for states of mixed character (0.1 ≤ ωCT < 0.9).

