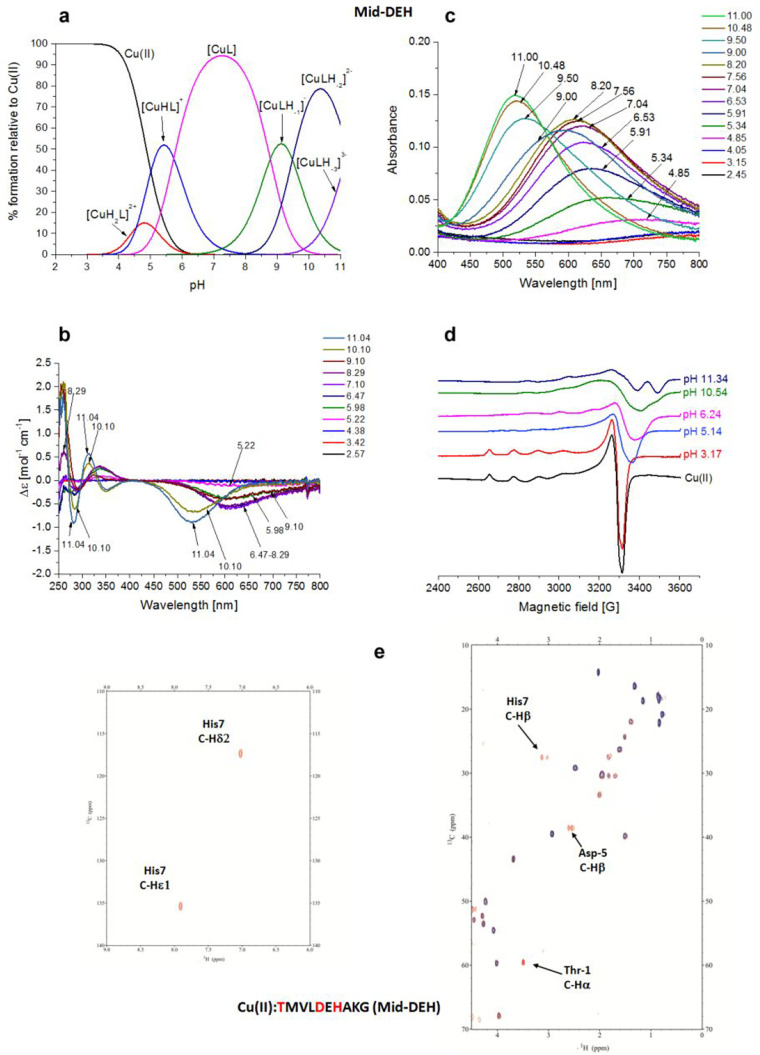
Figure 4.
Cu(II)–TMVLDEHAKG (Mid-DEH) system. (a) Species distribution of Cu(II) complexes, at 298 K and a 0.1 M NaClO4 ionic strength. [Cu(II)]tot = 1 mM; 1:1.1 Cu(II):L molar ratio. (b) CD spectra as a function of pH. (c) UV–vis spectra as a function of pH. (d) EPR spectra as a function of pH (conditions for CD, UV–vis, and EPR spectroscopy: [L] = 1 mM, 1:1.1 Cu(II):L molar ratio, I = 0.1 M NaClO4). (e) Aromatic and aliphatic region of the 1H–13C HSQC spectrum of free Mid-DEH (red) and the Cu(II)–Mid-DEH system at a 0.02:1 molar ratio (blue) and pH 7. Disappearing peaks and those with major broadening are labeled.

