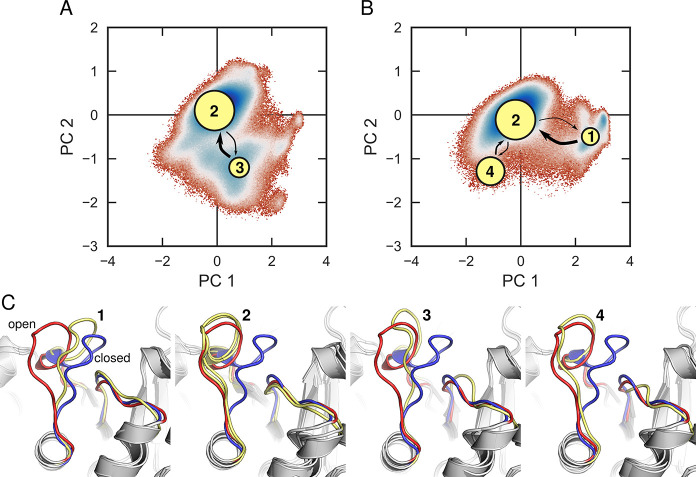
Figure 5.
Superimposition of Markov state models (MSMs)130,131 of (A) unliganded triosephosphate isomerase (TIM) and (B) TIM in complex with substrate dihydroxyacetone phosphate (DHAP), onto the corresponding free energy surfaces (T = 300 K) obtained from performing principal component analysis (PCA) on conventional MD simulations of each system. The free energy surfaces are defined in terms of the first two principal components, PC1 and PC2. The area of the nodes representing each of the metastable states in panels (A) and (B), and the thickness of the arrows connecting them, correspond to the populations of each node and the transition probabilities between them, respectively (note that areas and thicknesses do not scale linearly with transition probabilities). Shown here also are (C) overlays of representative structures from each of the metastable states sampled in these simulations, with the crystallographic “open” and “closed” conformations of the loop shown in red and blue, respectively, and the loop conformation at each state shown in yellow. Note that the metastable state 2 is virtually identical for simulations of both the liganded and unliganded forms of the enzyme. For details, see ref (129). Reprinted with permission from ref (129). Copyright 2018 American Chemical Society.

