Figure 6.
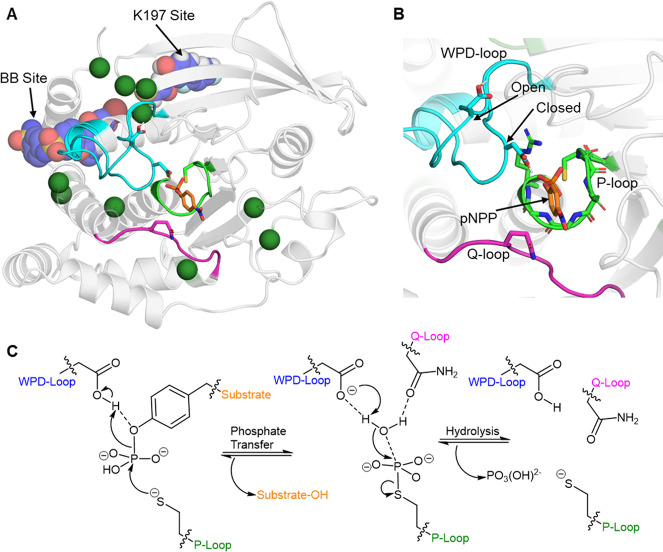
(A, B) Aligned crystal structures of PTP1B with the WPD-loop in its closed and open conformations, respectively (PDB: 6B90,134 this structure contains both conformations of the loop). Panel (A) depicts the overall structure of PTP1B, highlighting the three major loops which make up the active site (WPD-loop: cyan, P-loop: green, and Q-loop: purple) indicated. The two known allosteric drug binding sites on PTP1B are labeled and depicted with a representative drug bound to each site (BB site, PDB ID: 1T49,135 and K197 site, PDB ID: 6B95(134)). Dark green spheres are residues not located within the active site, but where single-point substitutions have been shown to alter PTP1B’s kcat or Km by |>50%| (data collated from refs (134, 136−139)). (B) A close-up of the PTP1B active site, with a model substrate p-nitrophenyl phosphate (pNPP) bound. The backbone nitrogen atoms and the arginine side chain on the P-loop that are harnessed to coordinate the phosphate group are also shown. (C) Conserved two-step reaction mechanism utilized by PTPs.133

