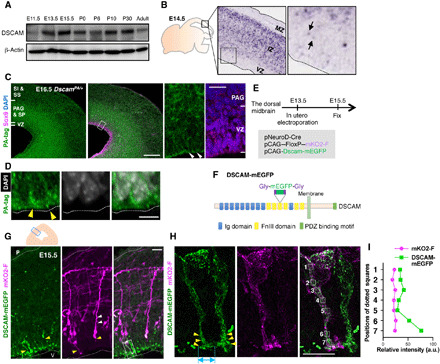
Fig. 1. Expression and localization of DSCAM in the dorsal midbrain during early neurogenesis.

(A) Temporal expression profiles of DSCAM protein in the midbrain from E11.5 to adult stage (P90). (B) In situ hybridization analysis of a mouse embryo (GenePaint.org). Black arrows indicate weak signals in the VZ. (C) Immunohistochemical analyses using anti-PA tag and Sox9 antibodies. Scale bar, 200 μm. Areas surrounded by white dotted lines are shown at higher magnification on the right. White arrowheads indicate accumulation of DSCAM-PA signals. Scale bar, 20 μm. (D) DSCAM-PA accumulated at the apical ventricular surface (yellow arrowheads) just beneath DAPI-positive nuclei. Scale bar, 5 μm. (E) Experimental design. (F) Diagram of the DSCAM-mEGFP protein domain structure. (G) DSCAM-mEGFP and mKO2-F expression in the dorsal midbrain. Upper schematic depicts coronal section of dorsal midbrain. Small blue box indicates area showing fluorescence image. White and yellow arrowheads indicate basal and apical processes, respectively. Higher magnification in (H) represents area surrounded by dotted box in (G). P, pia; V, ventricle. Scale bar, 20 μm. (H) Enlarged image of mKO2-F–positive neurons abutting apical endfeet into the ventricular surface. Yellow arrowheads indicate the accumulation of DSCAM-mEGFP. Light blue double-headed arrow indicates size of widely spread palm-like structures at the endfeet tip. Numbered areas in the merged image correspond to the fluorescence intensity measurement position in (I). Scale bar, 10 μm. (I) Relative intensity of mKO2-F and DSCAM-mEGFP. a.u., arbitrary units.
