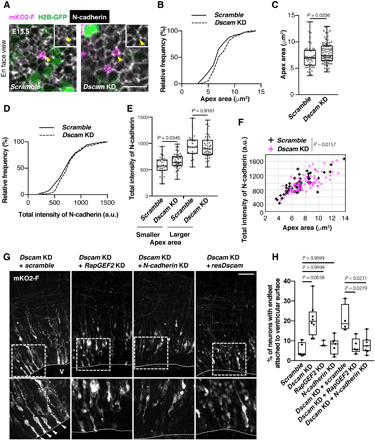
Fig. 6. DSCAM regulates neuronal delamination via RapGEF2 and N-cadherin down-regulation.

(A) En face view of E15.5 dorsal midbrain that was electroporated in utero at E13.5. The outline of this experiment is described in Fig. 2A. Yellow arrowheads indicate collected apex areas. Scale bar, 10 μm. (B) Cumulative distribution and (C) quantification of the size of the endfeet apex area. (B and C) Scramble, n = 50 cells from three animals; Dscam KD, n = 88 cells from three animals. Box plots show median (horizontal line), quartiles (box), and range (whiskers); Mann-Whitney test. (D) Cumulative distribution of normalized fluorescence intensity of N-cadherin in apex of endfeet. This was calculated by the ratio of the average pixel intensity within the apical circumference of one transfected cell versus the mean of average pixel intensity of four to seven of its close nontransfected neighbors. (E) Quantification of normalized fluorescence intensity of N-cadherin level ratio. A smaller population was defined as the size of the apex area of endfeet being smaller than the median size, and the other half was defined as larger [smaller, n = 25 cells; Dscam KD, n = 44 cells, box plots show median (horizontal line), quartiles (box), and range (whiskers), Mann-Whitney test]. (F) Scatter plot of N-cadherin intensity and apex area for control and Dscam KD brains. ANCOVA test. (G) Coronal sections of E15.5 dorsal midbrain expressing mKO2-F that were coelectroporated with indicated vectors. White arrowheads indicate excess endfeet formation. Higher magnification in bottom panels represents areas surrounded by the dotted box. V, ventricle. Scale bar, 50 μm. (H) Analysis of the number of mKO2-F–positive neurons bearing endfeet. Box plots show median (horizontal line), quartiles (box), and range (whiskers) from five to eight brains; Kruskal-Wallis test with Dunn’s multiple comparisons test.
