
Fig. 4. In vivo PA imaging and antitumor study of AHL and ML.
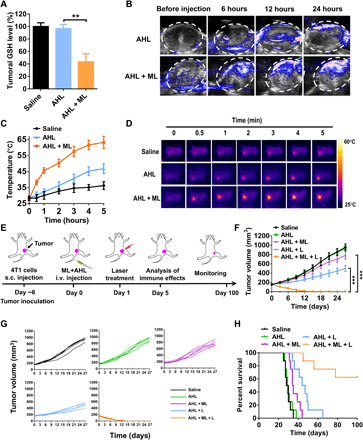
(A) Tumoral GSH detection after treatment with saline, AHL, or AHL + ML (n = 3). **P < 0.01. (B) PA images of 4T1 tumor after intravenous (i.v.) injection of AHL or AHL + ML. (C) Tumor temperature changing after treatment with saline, AHL, or AHL + ML and laser irradiation (n = 3). (D) Photothermal imaging and tumoral temperature analysis of the mice using an IR camera after treatment with saline, AHL, or AHL + ML. (E) Schematic illustration of the animal experimental design. (F) Primary tumor growth curves with the mean tumor volumes of 4T1 tumor–bearing BALB/c mice model (n = 5). ***P < 0.001. s.c., subcutaneous. (G) Primary tumor growth curves of individual mouse in different groups of 4T1 tumor–bearing BALB/c mice model. (H) The survival percentages of the tumor-bearing BALB/c mice (n = 8).