
Fig. 3. Droplet transmission through face masks.
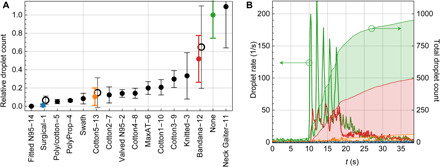
(A) Relative droplet transmission through the corresponding mask. Each solid data point represents the mean and SD over 10 trials for the same mask, normalized to the control trial (no mask), and tested by one speaker. Hollow data points are the mean and SDs of the relative counts over four speakers. A plot with a logarithmic scale is shown in fig. S1. The numbers on the x-axis labels correspond to the mask numbers in Fig. 2 and Table 1. (B) The time evolution of the droplet count (left axis) is shown for representative examples, marked with the corresponding color in (A): no mask (green), bandana (red), cotton mask (orange), and surgical (blue, not visible on this scale). The cumulative droplet count for these cases is also shown (right axis). t, time.