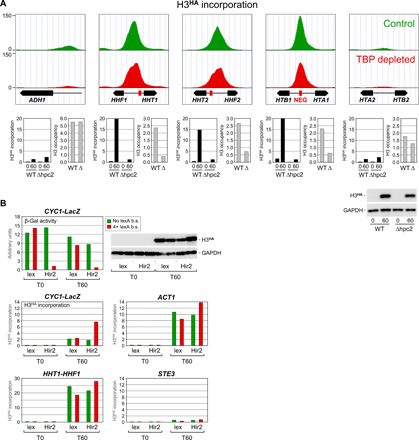
Fig. 6. HIR-mediated histone incorporation at the NEG-containing histone loci.

(A) Upper panels: H3HA incorporation under control (green) or TBP depletion (red) conditions at the four histone loci and at the highly transcribed ADH1 gene. Data are presented as in Fig. 1B but using a different scale on the y axis. Lower panels: H3HA incorporation (black bars) and H3 occupancy (gray bars) in wild-type cells or in cells carrying a deletion (Δ) of the gene encoding the Hpc2 subunit of the HIR complex. See fig. S5 for experimental detail. H3 occupancy levels are relative to those measured within a subtelomeric region on chromosome VI, which was set to 10. Note that the H3 occupancy results for ADH1 are presented on a different scale. Lower right: Western blot analysis of H3HA expression. (B) Transcriptional repression by artificial recruitment of the HIR complex. Upper left panel: The activity of a CYC1 promoter–driven β-galactosidase reporter gene (CYC1-LacZ) carrying (red) or not (green) four upstream LexA-binding sites was monitored in G1-arrested cells expressing LexA alone or LexA fused to the Hir2 subunit of the HIR complex (36). See text and fig. S5 for experimental details. Lower panels: H3HA incorporation within the upstream promoter regions of the indicated genes. Note the different scales on the y axis. b.s., binding sites.
