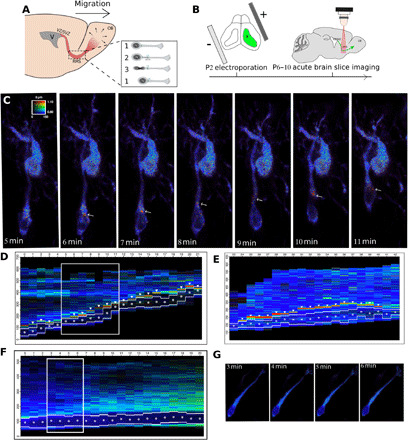
Fig. 1. cAMP dynamics in migrating neurons of the postnatal RMS.

(A) V/SVZ–olfactory bulb (OB) migration pathway and cyclic saltatory migration. 1: pause. 2: leading process extension and centrosome forward movement CK. 3: NK. VZ, ventricular zone; SVZ, sub-ventricular zone. (B) Postnatal experimental procedure. (C) Live two-photon imaging of a representative migrating neuron transfected by Epac-SH187. The white arrows show a dynamic cAMP hotspot present during NK. A nonmigrating transfected cell is present in the field of view. (D) Kymograph of the migrating neuron shown in (C) (time points within the white rectangle) with additional time points showing a second NK (see also movie S1). (E) Kymograph of another migrating neuron transfected by Epac-SH187 (movie S2). All kymographs display the ratiometric measures of the biosensor along the migration direction, with the hotspot indicated by arrowheads. The position of the nucleus is indicated by white lines (borders of the nucleus) and a white dot (center of the nucleus). (F) Kymograph of the nonmigrating neuron transfected by Epac-SH187 shown in (F) (movie S3). (G) Four time points of the cell represented in kymograph. The cell does not migrate but looks healthy.
