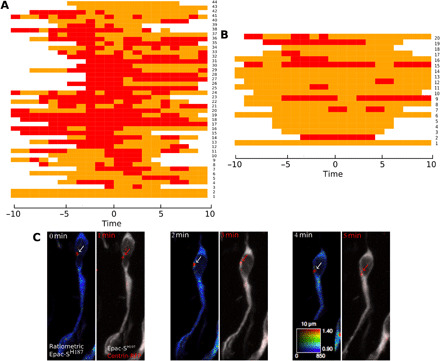
Fig. 2. Occurrence of hotspot and colocalization with centrosome.

(A) Heatmap of the time course of hotspot presence in multiple migrating neurons. Time 0 is defined as the midpoint of NK. (B) Heatmap of the time course of hotspot presence in multiple nonmigrating neurons. Each row represents a single cell, and each column represents a time point. The presence of the hotspot at a given time point is represented as a red rectangle and its absence as an orange rectangle. White rectangle corresponds to nonrecorded time points. The frequency of the hotspot presence (red) is reduced in nonmigrating neurons as compared to migrating ones. Mann-Whitney test (U = 674.75, P = 0.001). Note that the occasional presence of a hotspot in nonmigrating cells might correspond to an NK that happened just before recording. (C) Live two-photon and confocal imaging of a representative migrating neuron transfected by Epac-SH187 and centrin-RFP. A dynamic cAMP hotspot (white arrows) is present at the centrosome (red arrows).
