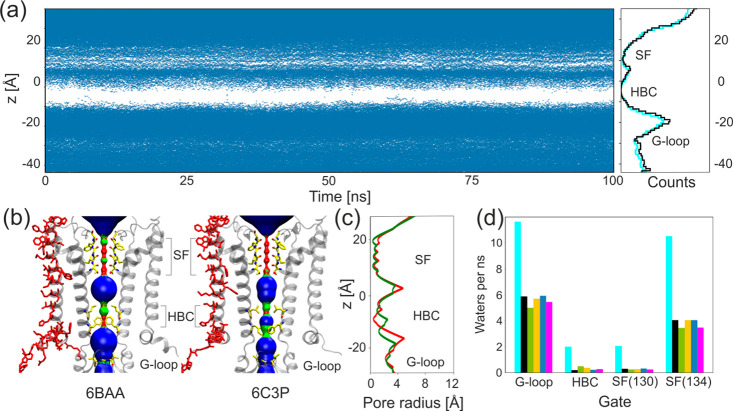
Figure 4.
KATP channel gating. (a) Water occupancy along the pore during an example simulation run; every blue dot represents a single water molecule in the pore cavity. Right: average water occupancy per 1 Å slice along the pore axis for model K (cyan) and model KS (black). (b) Pair of Kir6.2 subunits forming the gate region in two crystal structures (inward open 6BAA and outward open 6C3P). Pore residues directly interacting with SUR1 are in red, and residues responsible for gating are shown in yellow. Volumes representing the diameter of the pore were calculated using HOLE: wide areas of the pore (pore radius >2.3 Å) are blue, water accessible parts (1.15 Å > pore radius < 2.30 Å) are green, and parts that are inaccessible to water (pore radius <1.15 Å) are red. (c) Comparison of the HOLE profiles of the pore radius of inward open 6BAA (red) and outward open 6C3P (green).43 (d) Average water flux per 1 ns of simulation for four gating regions calculated for all models: model K (cyan), model KS (black), model KNt26 (green), model KNt37 (yellow), model KNt48 (blue), and model KNtM (magenta).

