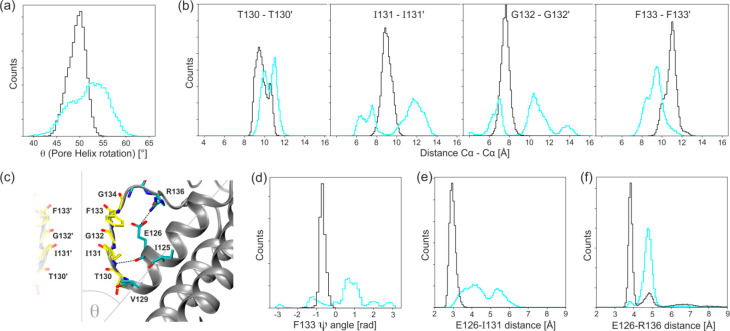
Figure 6.
Histograms showing the differences in the SF region dynamics between model K (cyan) and model KS (black): (a) the pore-helix rotation, (b) the distances between Cα atoms of the opposite SF residues, and (c) cartoon diagrams depicting interactions within the selectivity filters and surrounding. Selectivity filter residue carbon atoms are yellow, and calculated bonds are shown as dashed black lines. (d) The dihedral angle ψ of F133, (e) the distance of the hydrogen bond forming residues E126 and I131, and (f) the distance between the salt bridge forming residues E126 and R136.

