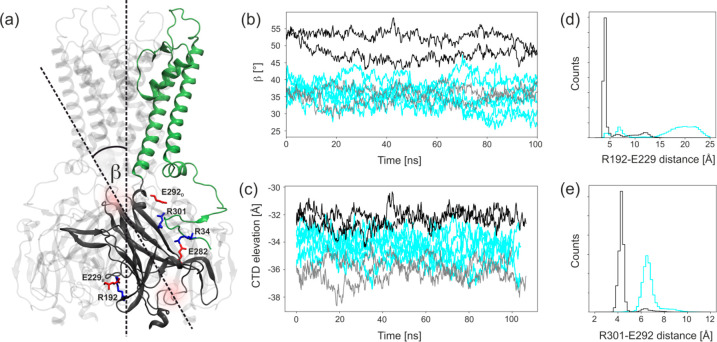
Figure 7.
Dynamics of the CTD domain. (a) Ribbon diagram of Kir6.2 tetramer showing interdomain interactions of CTD. (b) An angle β between CTD and the pore axis. (c) Position of the center of mass of CTD along the pore axis for model K (cyan) and model KS. Gray color states for the Kir6.2 chain without direct contact with SUR1 in model KS. (d, e) The closest distance between the residues forming salt bridges.

