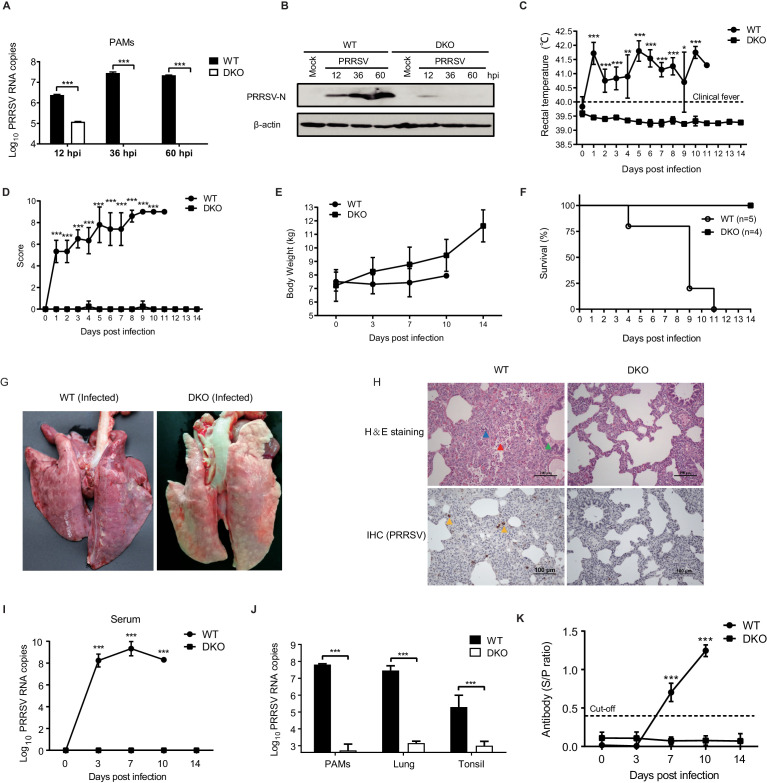
Figure 2. DKO pigs are resistant to genotype 2 PRRSV infection.
(A) qRT-PCR detection of PRRSV load and (B) western blot confirmation of PRRSV-N protein expression in PAMs from WT and DKO pigs at 12, 36, and 60 hpi (MOI = 0.1). (C) Rectal temperatures and (D) clinical symptoms scores were recorded daily beginning at 0 dpi to 14 dpi. Temperatures > 40°C were considered fever. WT: 0 to 4 dpi, N = 6; 5 to 8 dpi, N = 5; 9 dpi, N = 4; 10 dpi, N = 2; 11 dpi, N = 1. DKO: 0 to 14 dpi, N = 4. (E) Body weights measured at 0, 3, 7, 10, and 14 dpi. WT: 0 to 3 dpi, N = 6; 7 dpi, N = 5; 10 dpi, N = 2. DKO: 0 to 14 dpi, N = 4. (F) Survival curves of WT and DKO pigs with PRRSV. WT, N = 5; DKO, N = 4. (G) Representative lesions of infected lungs. (H) H and E staining (top) of lesions in lung tissue; IHC (bottom) detection of viral antigens in PRRSV-infected lungs. Lymphocytic infiltration (blue triangle); necrotic cells in the alveolar wall (red triangle); bronchial wall dilated and filled with serous fluid (green triangle); PRRSV-N protein (yellow triangle) (I) PRRSV loads in serum at 0, 3, 7, 10, and 14 dpi. WT: 0 to 3 dpi, N = 6; 7 dpi, N = 5; 10 dpi, N = 2. DKO: 0 to 14 dpi, N = 4. (J) PRRSV loads in PAMs (WT group: N = 3; DKO group: N = 3), lung tissues (WT: N = 5; DKO: N = 3), and tonsil tissues (WT: N = 5; DKO: N = 4). (K) PRRSV-specific antibodies in serum. WT: 0 to 3 dpi, N = 6; 7 dpi, N = 5; 10 dpi, N = 2. DKO: 0 to 14 dpi, N = 4. Data are expressed as means ± SD. Statistical significance was determined by Student’s t test; ns, p>0.05; *p<0.05; **p<0.01; ***p<0.001.

