. 2020 Sep 2;9:e57132. doi: 10.7554/eLife.57132

Figure 4. DKO pigs exhibit reduced susceptibility to PDCoV.

(A) PDCoV-specific antibody detection in serum from both WT and DKO pigs at 0, 7, and 14 dpi. WT group: 0 dpi, N = 4; 7 dpi, N = 3; 14 dpi, N = 4. DKO group, N = 2. (B) Representative macroscopic lesions of the small intestines at 14 dpi from WT and DKO groups of pigs challenged with PDCoV. (C) H and E staining of small intestine segments sections to detect lesions; small intestine tissues were derived from PDCoV-infected WT and DKO pigs. Intestinal villi fusion, infiltration of lymphocytes in the intestinal mucosa, and a large number in the intrinsic membrane (blue arrow), and necrosis and shedding of intestinal mucosal intraepithelial cells and naked lamina propria (green arrow). (D) The ratio of intestinal villus height to the crypt depth derived from both WT and DKO pigs at 14 dpi. Mock: duodenum to ileum, N = 3. WT: duodenum to ileum, N = 3. DKO: duodenum to ileum, N = 3. Data are expressed as the mean ± SD. Statistical significance was determined by Student’s t-test; ns, p>0.05; *p<0.05; **p<0.01; ***p<0.001.

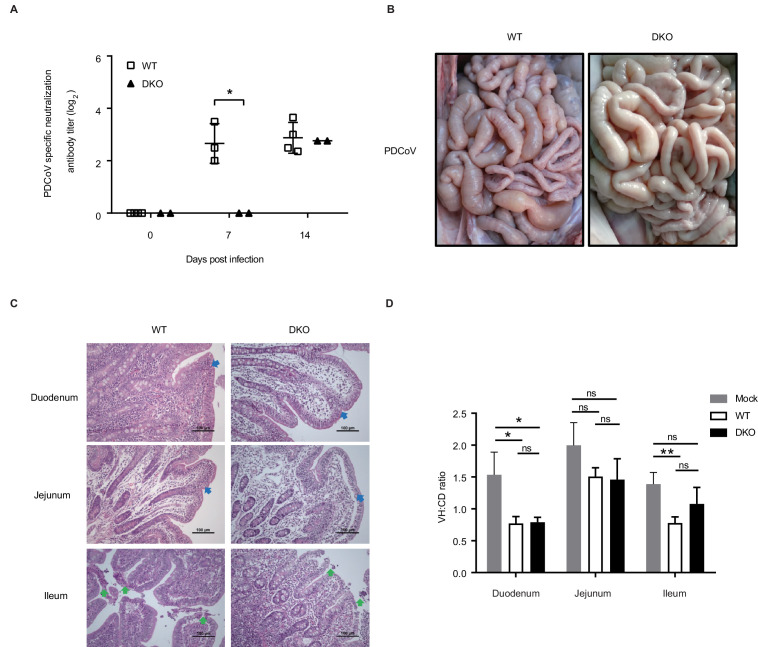
Figure 4—source data 1. PDCoV-specific neutralization antibody in serum.
Figure 4—source data 2. The ratio of intestinal villus height to the crypt depth in PDCoV group.

Figure 4.

Figure 4—figure supplement 1. PAMs of DKO pigs exhibit reduced susceptibility to PDCoV.

Figure 4—figure supplement 1.

(A) WT PAMs and DKO PAMs were infected or mock-infected with PDCoV (MOI = 10); at 24 hpi, PDCoV-N-specific fluorescence signals were detected by IFA. (B) WT PAMs and DKO PAMs were infected with PDCoV (MOI = 10); at 24 hpi, cells were collected and the viral titer was determined by TCID50 assays (in LLC-PK1 cells). (C, D) WT PAMs and DKO PAMs were infected with PDCoV (MOI = 10); at 24 hpi, cells were harvested and analyzed using qRT-PCR (C) and western blot assays (D). The PDCoV-N protein level was quantified by ImageJ. Data are expressed as the mean ± SD. Statistical significance was determined by Student’s t test; ns, p>0.05; *p<0.05; **p<0.01; ***p<0.001.
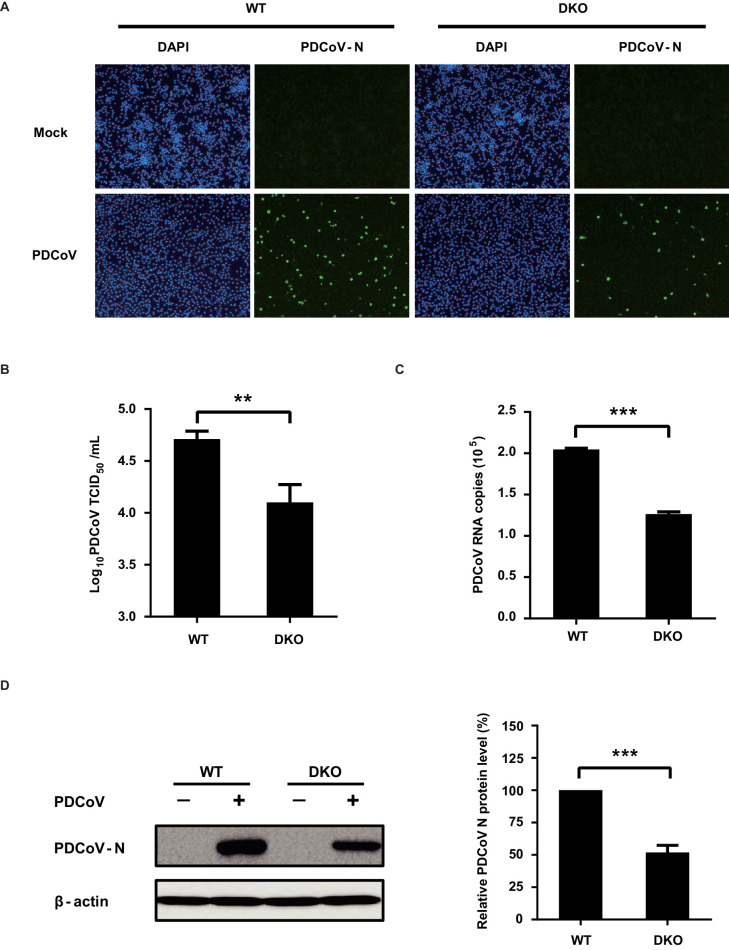
Figure 4—figure supplement 1—source data 1. The TCID50 detection of PDCoV titer in PAMs.
Figure 4—figure supplement 1—source data 2. The qRT-PCR detection of PDCoV RNA copies in PAMs.
Figure 4—figure supplement 1—source data 3. The western blot detection of the relative PDCoV-N protein level in PAMs.