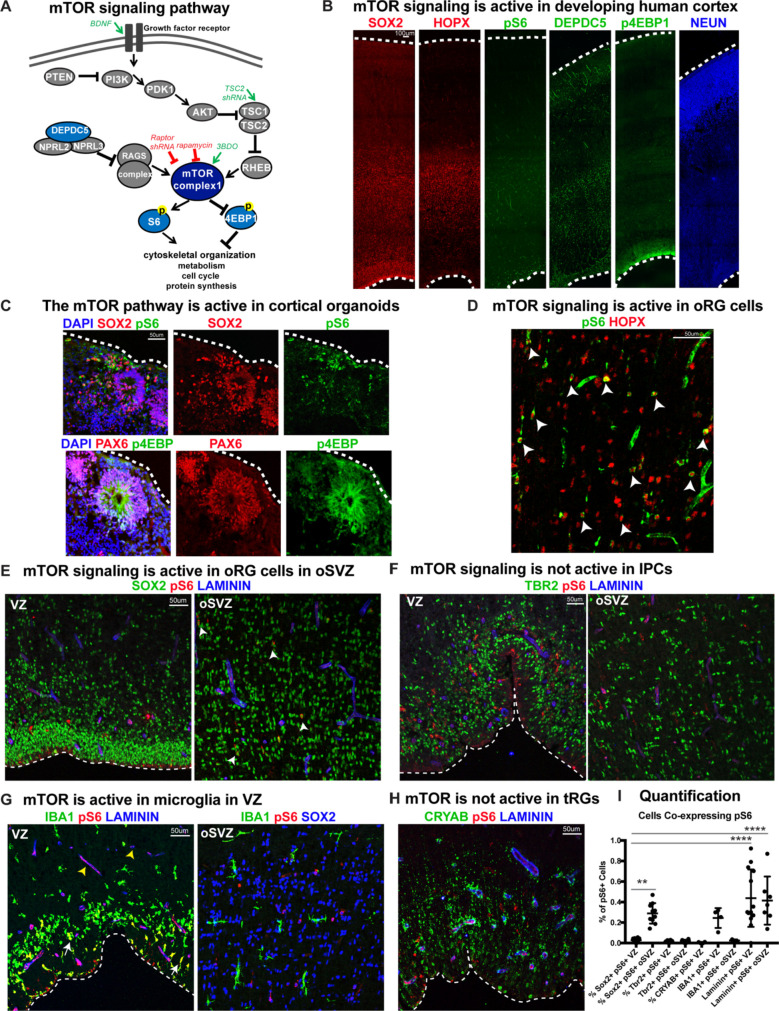
Figure 1. mTOR signaling is active in outer radial glial cells, but not other neural progenitor types, during human cortical development.
(A) Simplified schematic of the mTORC1 signaling pathway. mTOR signaling has many mediators and regulates diverse processes throughout development. Experimental approaches to mTOR manipulation are included in the diagram. Green text indicates activation and red indicates inhibition. (B) Radial glia expressing SOX2, oRG cells expressing HOPX and neurons expressing NEUN are present during human corticogenesis at GW17-19. mTOR signaling is active in the cortex at this time, indicated by the presence of phosphorylated S6 (pS6) protein. Other mTOR pathway proteins like DEPDC5 and p4EBP1 are also expressed during this period. (C) mTOR pathway proteins are also expressed and active in the radial glia of eight week old cortical organoids. (D) pS6 is present in many, but not all, oRG cells in the oSVZ of the developing human cortex, indicating active mTOR signaling. White arrowheads indicate oRG cells co-expressing pS6 and HOPX. (E) pS6 is absent in SOX2+ vRGs in the VZ but present in laminin-expressing blood vessels. Of the neural progenitor populations, only SOX2+ oRG cells in the oSVZ co-express pS6 (white arrowheads). (F) pS6 is absent in TBR2+ IPCs in both the VZ and the oSVZ. (G) mTOR signaling is active in IBA1+ microglia (white arrows) and laminin+ blood vessels at the VZ (yellow arrowheads). However, in the oSVZ there is little mTOR activity in the microglia, but extensive co-labeling of SOX2+ oRG cells. (H) CRYAB+ tRGs do not express pS6. (I) Quantification of pS6+ cells co-labeled with each marker, SOX2, TBR2, CRYAB, LAMININ and IBA1, at the VZ or oSVZ expressed as a percentage of the total number of pS6+ cells. Significant mTOR activity is present only in the SOX2+ oRG cells in the oSVZ and in the laminin+ blood vessels in the VZ and oSVZ. (n = 28 sections from 3 individuals across eight independent experiments; D’Agostino-Pearson normality test: normally distributed; one way ANOVA with multiple comparisons: SOX2+ VZ vs SOX2+ oSVZ: **p<0.0031; SOX2 VZ vs Laminin VZ, Laminin oSVZ: ****p<0.0001; Scatter plot with individual data points, error bars indicate SD and the middle line is the mean).

