. 2020 Sep 2;9:e58737. doi: 10.7554/eLife.58737

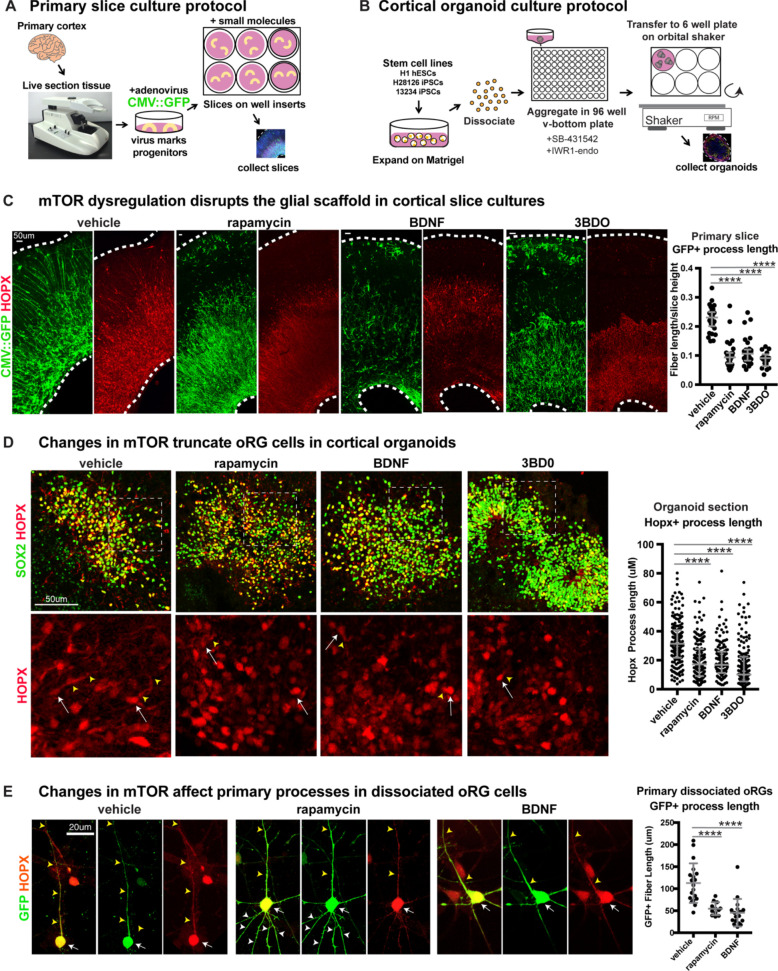
Figure 2. Manipulating mTOR signaling disrupts the glial scaffold in primary cortical cultures and organoids.

(A) Primary cortical tissue was acutely sectioned and cultured at the air-liquid interface. Small molecules were added the next day and cultured tissue slices were collected six days later. (B) Human pluripotent stem cells were dissociated and aggregated in medium inhibiting Smad and Wnt signaling to promote forebrain induction of cortical organoids. Small molecules were added at five weeks and organoids collected at 10 weeks. (C) Changes to mTOR signaling result in GFP+ HOPX+ glial scaffold disruption in primary cultures. Following mTOR manipulation with rapamycin, 3BD0 and BDNF, the length of GFP+ radial fibers in the oSVZ is significantly reduced (n = 10 vehicle, n = 9 rapamycin, n = 9 BDNF, n = 5 3BDO treated slices from >5 independent experiments; D’Agostino Pearson Normality Test: not normally distributed; Kruskal-Wallis Test: rapamycin: ****p<0.0001, BDNF: ****p<0.0001, ****3BD0: p<0.0001, median with interquartile range shown). (D) Manipulations of mTOR signaling result in HOPX+ oRG fiber truncation and changes to morphology in week 10 cortical organoids. White arrows indicate the cell body and yellow arrowheads illustrate process length. The length of the basal process is significantly smaller in HOPX expressing oRG cells (n = 171 control, n = 156 rapamycin, n = 141 BDNF and n = 162 3BD0 HOPX+ cells each from six organoids/group from three PSC lines; D’Agostino Pearson Normality Test: not normally distributed; Kruskal-Wallis Test: rapamycin: ****p<0.0001, BDNF: ****p<0.0001, ****3BD0: p<0.0001, median with interquartile range shown). (E) Primary dissociated oRG cells treated with mTOR modulators have shorter HOPX+ primary fibers and protrusion of other inappropriate processes. White arrows indicate cell body, yellow arrowheads indicate primary process and white arrowheads other processes (n = 19 vehicle, 12 rapamycin and 18 BDNF treated progenitor cells from three independent experiments; D’Agostino Pearson Normality Test: normally distributed; one-way ANOVA: rapamycin: ****p<0.0001, BDNF: ****p<0.0001; error bars represent SD).

Figure 2—source data 1.

Figure 2.

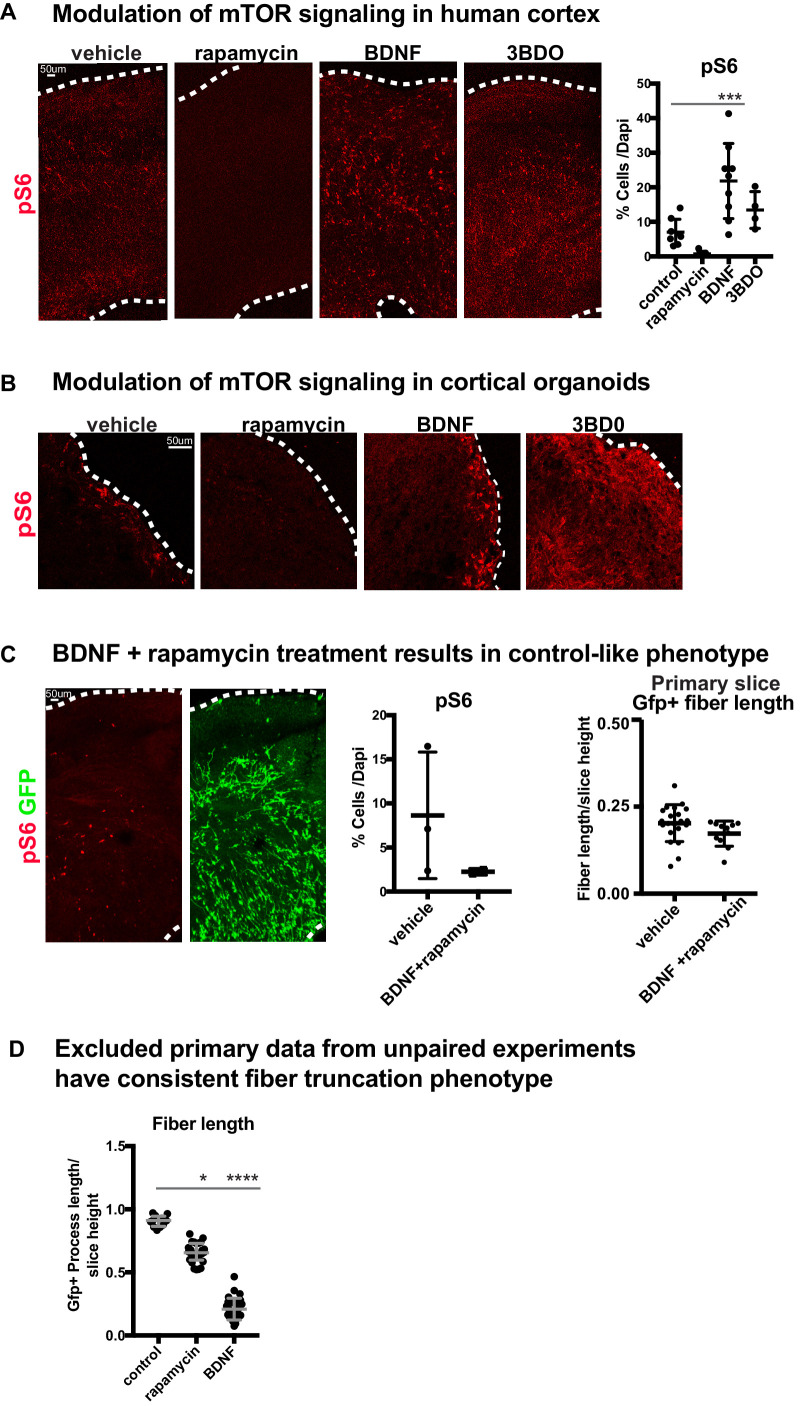
Figure 2—figure supplement 1. Manipulations of mTOR can be monitored through changes to pS6.

Figure 2—figure supplement 1.

(A) pS6 is detected in the oSVZ in primary human slice cultures. After rapamycin treatment, there is very little pS6 detected. BDNF or 3BDO treatments increase pS6 levels throughout the culture (n = 8 control, n = 7 rapamycin, n = 8 BDNF and n = 4 3 BDO-treated slices from four independent experiments; one-way ANOVA: p=0.314 rapamycin, ***p<0.0001 BDNF, p=0.438 3BD0, error bars represent SD). (B) In week 10 organoids, pS6 is present at the edge of the organoid and rapamycin treatment results in complete loss of pS6. BDNF modestly increases pS6 levels, while 3BDO treatment increases pS6 throughout the organoid (n = 6 control, rapamycin, BDNF and 3BDO-treated organoids from three PSC lines). (C) When organotypic primary slice cultures are treated with BDNF and rapamycin together, pS6 expression returns to control-like levels (n = 3 slices control, n = 2 slices BDNF+rapamycin across two independent experiments; unpaired student’s t-test: p=0.22, error bars represent SD). GFP+ fiber organization improves compared to either mTOR manipulation alone (n = 21 control cells, n = 11 BDNF+rapamycin cells; unpaired student's t-test: p=0.102, error bars represent SD). (D) Due to limited access to primary human tissue, some experimental data in human slices did not include paired-controls or were missing some treatment conditions. These data were excluded from the main study. Nonetheless, these experiments demonstrated the same phenotype; GFP+ basal process length was reduced after mTOR manipulation (n = 12 control cells from two slices, n = 26 rapamycin cells from three slices and n = 28 BDNF cells across four slices; D’Agostino Pearson Normality Test: not normally distributed; Kruskal-Wallis Test: rapamycin: *p<0.0137, BDNF: ****p<0.0001, median with interquartile range shown).
Figure 2—figure supplement 1—source data 1.
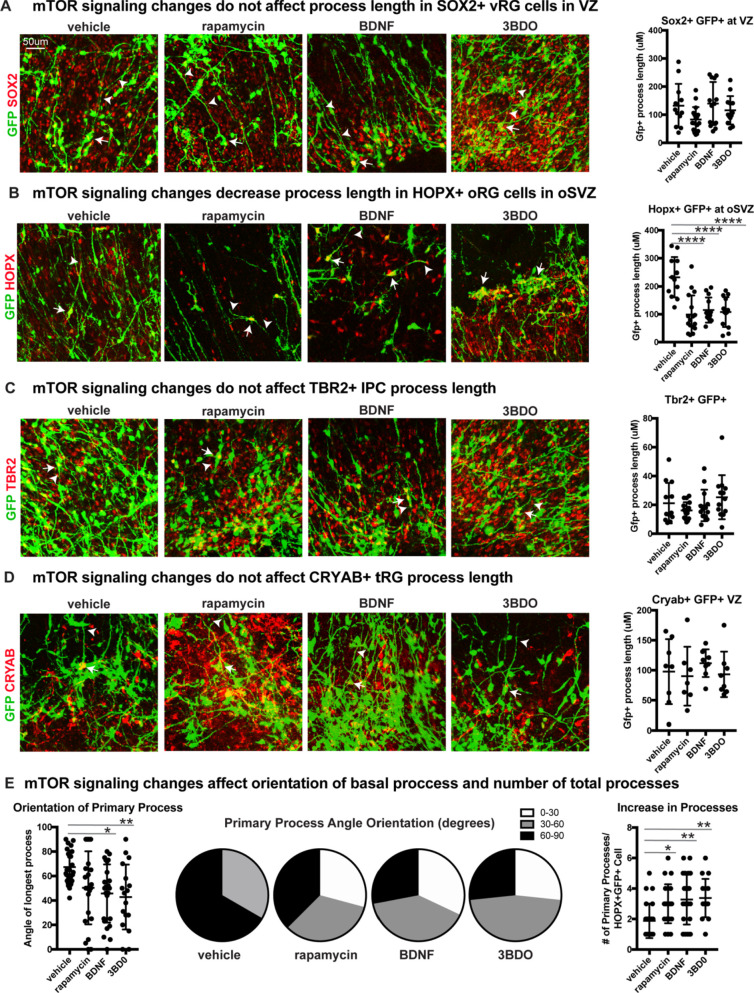
Figure 2—figure supplement 2. mTOR signaling has functional effects only on oRG progenitor cells.

Figure 2—figure supplement 2.

(A) mTOR signaling was manipulated using rapamycin, BDNF or 3BD0 in primary organotypic slice cultures infected with a CMV::GFP adenovirus to label the glial scaffold. There is no significant change to the GFP+ process length of SOX2+ GFP+ ventricular radial glia in the VZ (n = 12 vehicle, n = 17 rapamycin, n = 13 BDNF, n = 13 3BD0 cells across three independent experiments; D’Agostino Pearson Normality Test: normally distributed; one-way ANOVA with multiple comparisons: rapamycin: p=0.172, BDNF: p=0.990, p=0.912, error bars represent SD). White arrows indicate GFP+SOX2+ cell body and white arrowheads indicate process length. (B) There is a significant reduction in the length of HOPX+GFP+ basal processes in oRG cells in the oSVZ, in all mTOR treatment groups (n = 12 vehicle, n = 17 rapamycin, n = 13 BDNF, n = 13 3BD0 cells across three independent experiments; D’Agostino Pearson Normality Test: normally distributed; one-way ANOVA with multiple comparisons, rapamycin: ****p<0.0001; BDNF: ****p<0.0001; 3BD0: ****p<0.0001, error bars represent SD). White arrows indicate GFP+HOPX+ cell body and white arrowheads indicate process length. (C) Manipulation of mTOR signaling does not affect process length in TBR2+GFP+ intermediate progenitor cells (n = 12 vehicle, n = 17 rapamycin, n = 13 BDNF, n = 13 3BD0 cells n > 4 cells/slice across three independent experiments; D’Agostino Pearson Normality Test: not normally distributed; Kruskal-Wallis test with multiple comparisons: rapamycin: p>0.999, BDNF: p>0.999, 3BD0: p>0.999, error bars indicate SD). White arrows indicate GFP+TBR2+ cell body and white arrowheads indicate process length. (D) Changes to mTOR signaling do not affect fiber length in CRYAB+ GFP+ truncated radial glia (n = 8 vehicle, n = 7 rapamycin, n = 8 BDNF, n = 8 3BD0 across three independent experiments; D’Agostino Pearson Normality Test: not normally distributed; Kruskal-Wallis test with multiple comparisons: rapamycin: p>0.999, BDNF: p>0.999, 3BD0: p>0.999, error bars indicate SD). White arrows indicate GFP+CRYAB+ cell body and white arrowheads indicate process length. (E) Angle of primary process compared to the ventricular surface (0–90 degrees). mTOR manipulations affect the orientation of the basal fiber and decrease the average angle orientation (n = 24 vehicle, n = 23 rapamycin, n = 24 BDNF, n = 17 3BD0 cells across three independent experiments; D’Agostino Pearson Normality Test: normally distributed; one-way ANOVA with multiple comparisons: rapamycin: p=0.08, BDNF: *p<0.0116, 3BD0: **p<0.0096, error bars represent SD). Data also represented in proportions of cells from 0 to 30, 30–60, or 60–90 degrees per treatment group in pie charts. mTOR manipulations increase the number of processes (n = 24 vehicle, n = 23 rapamycin, n = 24 BDNF, n = 17 3BD0 cells; D’Agostino Pearson Normality Test: not normally distributed; Kruskal-Wallis test with multiple comparisons: rapamycin: *p<0.0318, BDNF: **p<0.0037, 3BD0: **p<0.0053, error bars represent SD).
Figure 2—figure supplement 2—source data 1.
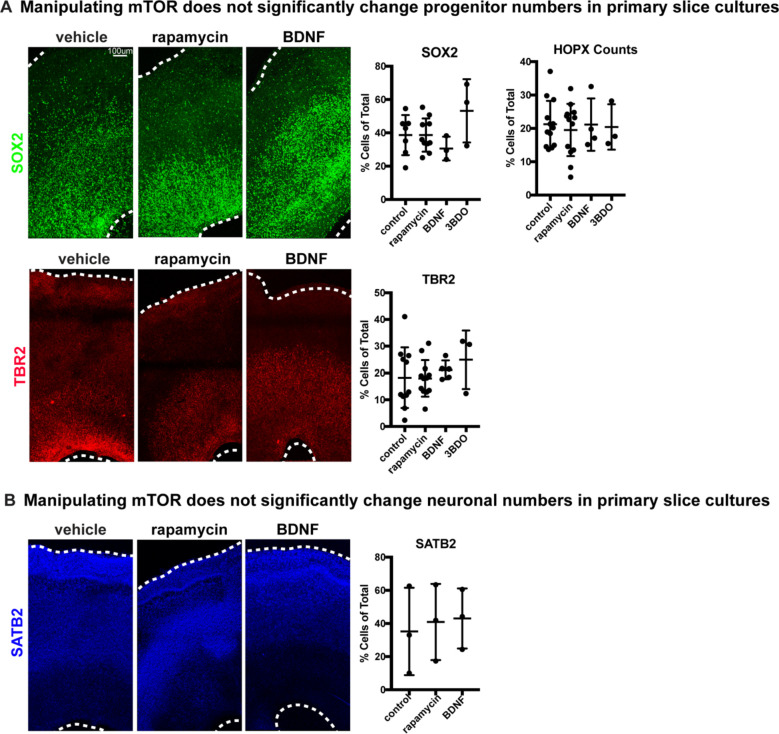
Figure 2—figure supplement 3. Manipulating mTOR signaling does not affect progenitor or neuronal numbers in slice cultures.

Figure 2—figure supplement 3.

(A) Activating or inhibiting mTOR in primary slice cultures has no effect on progenitor numbers There is no significant change in the numbers of SOX2+ progenitors, HOPX+ oRGs, or TBR2+ IPCs (SOX2: n = 7 vehicle, n = 10 rapamycin, n = 3 BDNF, n = 3 3BD0 slices across three independent experiments, one-way ANOVA with multiple comparisons: p=0.999 rapamycin, p=0.747 BDNF, p=0.299 3BD0; TBR2: n = 11 vehicle, n = 12 rapamycin, n = 5 BDNF, n = 3 3BD0 slices across >three independent experiments, one-way ANOVA with multiple comparisons: p=0.999 rapamycin, p=0.927 BDNF, p=0.649 3BD0; HOPX: n = 13 vehicle, 13 rapamycin, n = 4 BDNF, n = 3 3BD0 across >three independent experiments, one-way ANOVA with multiple comparisons: p=0.932 rapamycin, p>0.999 BDNF, p=0.9981 3BD0, error bars represent SD). (B) Activating or inhibiting mTOR in primary slice cultures has no effect on SATB2+ upper layer neurons (one-way ANOVA with multiple comparisons: p=0.932 rapamycin, p>0.999 BDNF, p=0.9981 3BD0; SATB2: n = 3 slices/group, one-way ANOVA with multiple comparisons: p=0.950 rapamycin, p=0.908 BDNF, p=0.993 3BD0, error bars represent SD).
Figure 2—figure supplement 3—source data 1.
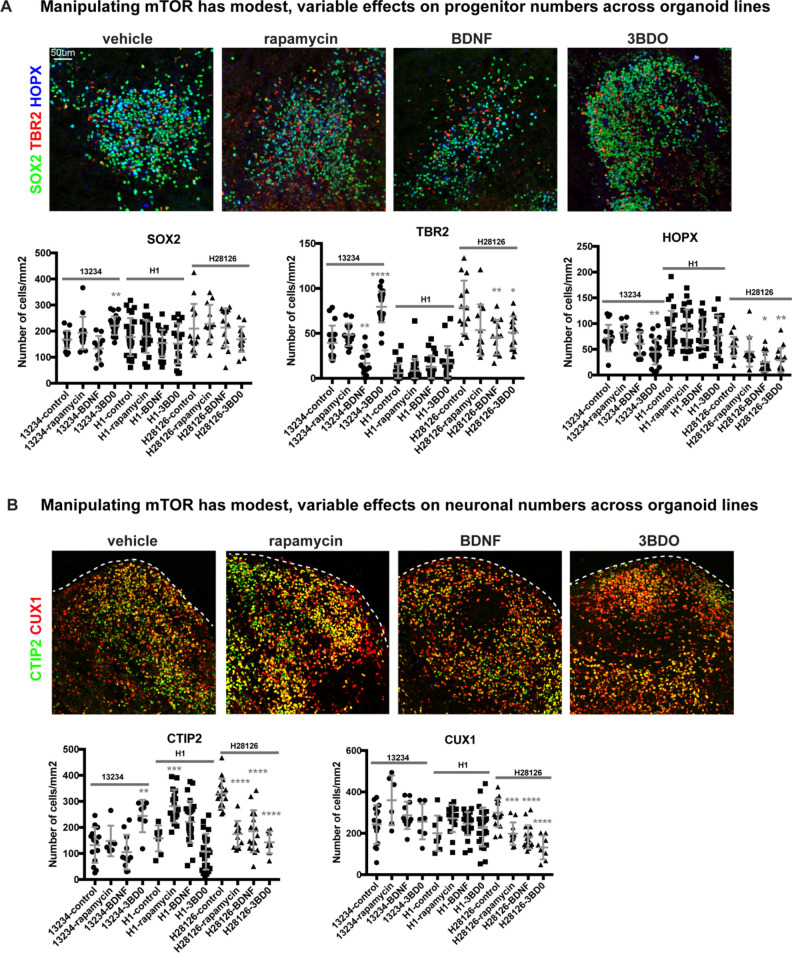
Figure 2—figure supplement 4. Effects of mTOR manipulations are variable across PSC lines and conditions resulting in little overall effect on progenitor and neuron numbers.

Figure 2—figure supplement 4.

(A) Three PSC lines were used for organoid studies: 13234, H2826 (iPSCs) and H1 (hESC). The number of cells positive for each marker was counted and then normalized to organoid size. Hyperactivating mTOR signaling has modest effects on progenitor numbers in week 10 organoids, but these effects were not consistent across all iPSC lines or conditions. There was no change to SOX2+ progenitors, except for a small increase in the 3BD0 condition derived from the 13234 iPSC line (SOX2: n = 17 13234 control, n = 26 H1-control, n = 14 H28126-control, n = 14 13234 rapamycin, n = 26 H1 rapamycin, n = 12 H28126 rapamycin, n = 11 13234 BDNF, n = 22 H1 BDNF, n = 14 H28126 BDNF, n = 22 13234 3BD0, n = 18 H1 3BD0, n = 14 H28126 3BD0 sections from >2 organoids/line across three independent experiments; one-way ANOVA with multiple comparisons: 13234 line: control vs rapamycin p=0.386, control vs BDNF p=0.189, control vs 3BD0 **p<0.0027; H1 line: control vs rapamycin p=0.999, control vs BDNF: p=0.630, control vs 3BD0: p=0.627; H28126 line: control vs rapamycin: p=0.927, control vs BDNF: p=0.999, control vs 3BD0: p=0.417, error bars represent SD). There was an inconsistent change to TBR2+ IPCs in the gain of function conditions in two iPSC lines, where both increase, decrease, and no change in numbers were observed (TBR2: n = 17 13234 control, n = 26 H1-control, n = 14 H28126-control, n = 14 13234 rapamycin, n = 26 H1 rapamycin, n = 12 H28126 rapamycin, n = 11 13234 BDNF, n = 22 H1 BDNF, n = 14 H28126 BDNF, n = 22 13234 3BD0, n = 18 H1 3BD0, n = 14 H28126 3BD0 sections; one-way ANOVA with multiple comparisons: 13234 line: control vs rapamycin p=0.433, control vs BDNF **p>0.004, control vs 3BD0 ***p<0.0001; H1 line: control vs rapamycin p=0.913, control vs BDNF p=0.404, control vs 3BD0 p=0.070; H28126 line: control vs rapamycin p=0.05, control vs BDNF **p<0.004, control vs 3BD0 *p<0.018, error bars represent SD). Overall, there was little effect on HOPX+ oRG number, but a small decrease was observed in mTOR activation conditions in two lines (n = 17 13234 control, n = 26 H1-control, n = 14 H28126-control, n = 14 13234 rapamycin, n = 26 H1 rapamycin, n = 12 H28126 rapamycin, n = 11 13234 BDNF, n = 22 H1 BDNF, n = 14 H28126 BDNF, n = 22 13234 3BD0, n = 18 H1 3BD0, n = 14 H28126 3BD0 sections from >2 organoids/line across three independent experiments; one-way ANOVA with multiple comparisons: 13234 line: control vs rapamycin: p=0.599, control vs BDNF p=0.579, control vs 3BD0 **p<0.004; H1 line: control vs rapamycin p=0.9950, control vs BDNF p=0.956, control vs 3BD0 p=0.726; H28126 line: control vs rapamycin p=0.717, control vs BDNF **p<0.007, control vs 3BD0 *p<0.022, error bars represent SD). Organoid images shown are derived from the 13234 iPSC line. (B) There are modest and inconsistent changes to neuronal populations in organoids. There is a small increase in CTIP2+ cells in the rapamycin treatment group of the H1 stem cell line and the 3BD0 group in the 13234 line, while there is a decrease in the H28126 line in all mTOR manipulation groups. (CTIP2: n = 15 13234 control, n = 8 H1-control, n = 16 H28126-control, n = 6 13234 rapamycin, n = 17 H1 rapamycin, n = 11 H28126 rapamycin, n = 11 13234 BDNF, n = 25 H1 BDNF, n = 17 H28126 BDNF, n = 7 13234 3BD0, n = 24 H1 3BD0, n = 8 H28126 3BD0 sections from >2 organoids/line across three independent experiments; one-way ANOVA with multiple comparisons: 13234 line: control vs rapamycin p=0.959, control vs BDNF p=0.733, control vs 3BD0 **p<0.004; H1 line: control vs rapamycin ***p<0.0006, control vs BDNF p=0.130, control vs 3BD0 p=0.291, H28126 line: control vs rapamycin, BDNF, 3BD0 ****p<0.0001, error bars represent SD). There is a decrease in CUX1+ neurons across mTOR manipulations in the H28126 line, but no change in organoid derived from other lines (CUX1: n = 15 13234 control, n = 8 H1-control, n = 16 H28126-control, n = 6 13234 rapamycin, n = 17 H1 rapamycin, n = 11 H28126 rapamycin, n = 11 13234 BDNF, n = 25 H1 BDNF, n = 17 H28126 BDNF, n = 7 13234 3BD0, n = 24 H1 3BD0, n = 8 H28126 3BD0 sections from >2 organoids/line across three independent experiments; one-way ANOVA with multiple comparisons: 13234 line: control vs rapamycin p=0.052, control vs BDNF p=0.617, control vs 3BD0 p=0.988; H1 line: control vs rapamycin p=0.130, control vs BDNF p=0.439, control vs 3BD0 p=0.763; H28126 line: control vs rapamycin: ***p<0.0005, control vs BDNF, 3BD0 ****p<0.0001, error bars represent SD). Organoid images shown are derived from the H1 ESC line.
Figure 2—figure supplement 4—source data 1.
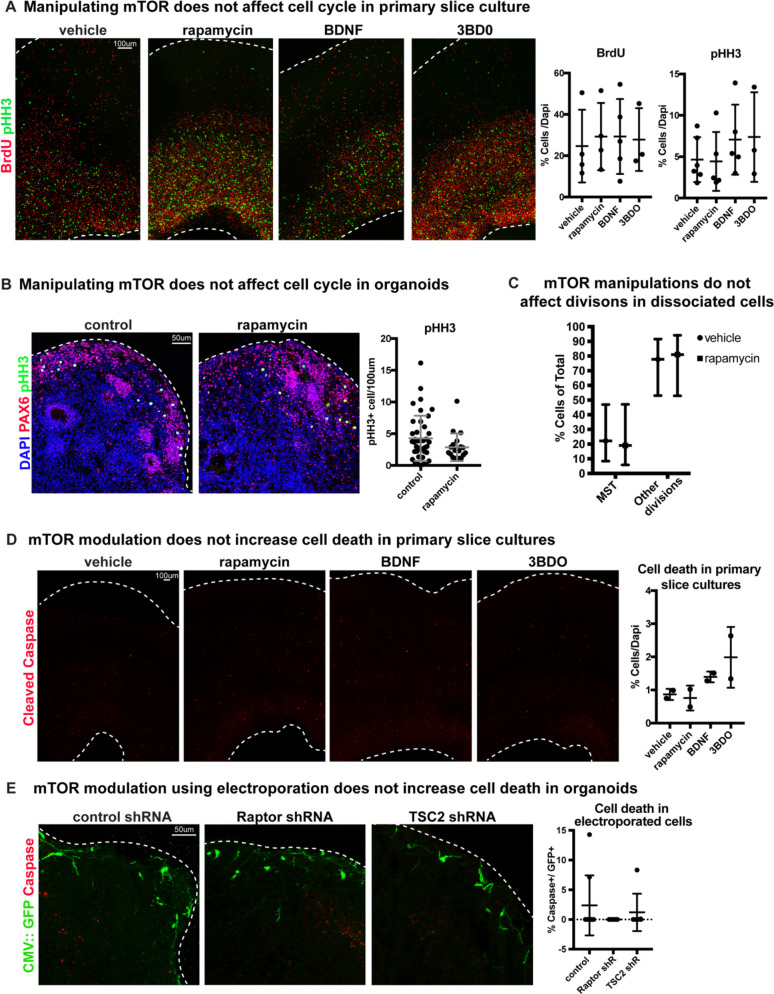
Figure 2—figure supplement 5. Changes to mTOR signaling do not affect cell cycle or cell death.

Figure 2—figure supplement 5.

(A) Manipulating mTOR signaling has no effect on BrdU+ progenitor cells during synthesis (S-phase) or pHH3+ mitotic (M-phase) cells in primary slice cultures (BrdU: n = 4 vehicle, n = 4 rapamycin, n = 5 BDNF, n = 3 3BD0 slices, across >three independent experiments; one-way ANOVA: p=0.908 rapamycin, p=0.977 BDNF, p=0.995 3BD0; pHH3: n = 6 vehicle, n = 5 rapamycin, n = 5 BDNF, n = 3 3BD0 across >three independent experiments, one-way ANOVA: p=0.997 rapamycin, p=0.726 BDNF, p=0.745 3BD0, error bars represent SD). (B) Inhibiting mTOR signaling has no effect on the number of mitotic pHH3+ cells in week 10 organoids. Counts were normalized to organoid size (n = 40 control and n = 19 sections from four organoids; unpaired student’s t-test p=0.118, error bars represent SD). (C) Rapamycin treatment has no effect on the ability of cells to divide and does not change the frequency of oRG MST in dynamically imaged primary radial glia (n = 27 vehicle, n = 21 rapamycin cells across two independent experiments, two-tailed student’s t-test: p=0.99, error bars SD). (D) Manipulating mTOR signaling pharmacologically does not increase the prevalence of cleaved caspase-3 in any condition (n = 2 slices/group, one-way ANOVA: p=0.996 rapamycin, p=0.741 BDNF, p=0.2664 3BD0, error bars represent SD). (E) Electroporation of mTOR shRNA constructs does not increase the number of GFP+ cleaved caspase+ cells compared to control electroporations in week 10 organoids (n = 9 control, n = 7 Raptor shRNA, n = 7 TSC2 shRNA sections from four organoids/group, one-way ANOVA: p=0.415 Raptor, p=0.798 TSC2, error bars represent SD).
Figure 2—figure supplement 5—source data 1.