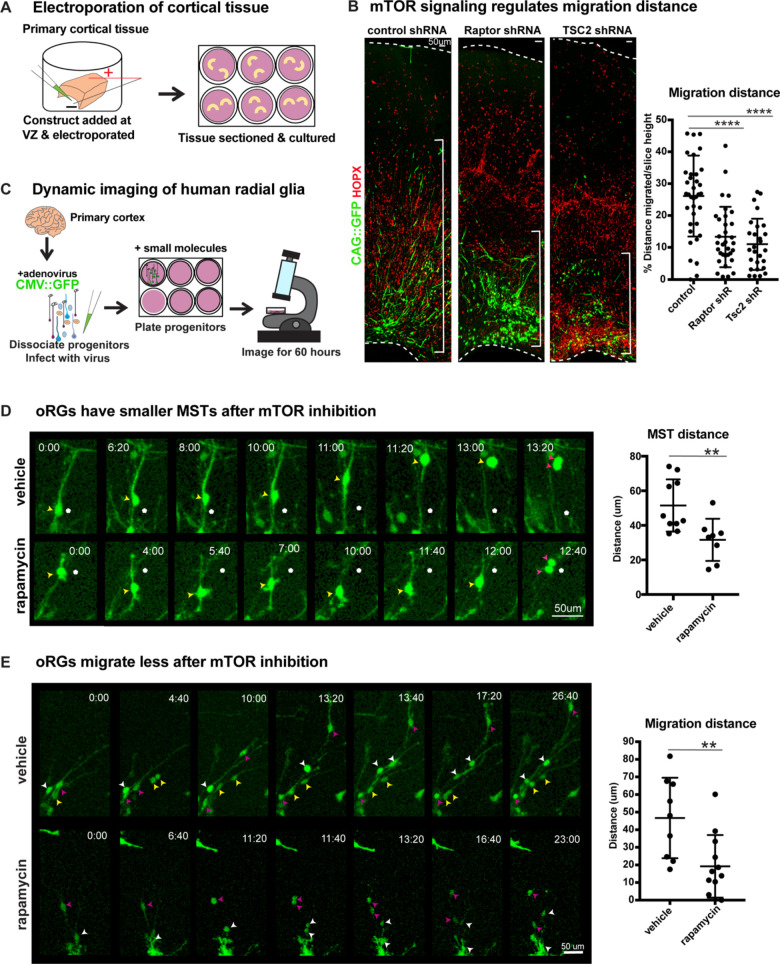
Figure 3. Manipulation of mTOR signaling results in migration defects.
(A) shRNAs were delivered along and electroporated onto the ventricular surface of primary cortical tissue which was then acutely sectioned and cultured for six days prior to collection. (B) After electroporation of RPTOR or TSC2 shRNAs, GFP+ HOPX+ oRGs migrate less from the ventricular edge (n = 37 control, n = 33 Raptor and n = 27 TSC2-shRNA electroporated GFP+Hopx+ cells from three independent experiments; D’Agostino Pearson Normality Test: normally distributed; one-way ANOVA with multiple comparisons: Raptor shRNA: ****p<0.0001, TSC2 shRNA: ****p<0.0001, error bars represent SD). The distance of each HOPX+ GFP+ cell away from the VZ edge was measured as indicated by white brackets. (C) For dynamic imaging studies, primary cortical tissue was collected, dissociated, infected with a CMV::GFP adenovirus, and plated on glass-bottom 12 well plates. Small molecules were added one day later, two hours before the start of dynamic imaging. (D) GFP+ oRG cells undergo division via MST. Yellow arrowheads indicate cell body, white dot indicates initial position of cell body and pink arrowheads indicate two cell bodies after division. After inhibition of mTOR signaling oRG cells have shorter MSTs (n = 10 control and n = 8 rapamycin cells across two independent experiments; D’Agostino Pearson Normality Test: normally distributed; unpaired two-tailed student’s t-tests: **p<0.0082, error bars represent SD). (E) oRGs migrate less from their original position after mTOR inhibition (n = 9 vehicle treated and n = 12 rapamycin treated cells from two independent experiments; D’Agostino Pearson Normality Test: normally distributed; unpaired two-tailed student’s t-tests: **p<0.0058 error bars represent SD). White, yellow, and pink arrowheads indicate cell bodies at starting time-point. Multiple arrowheads of the same color over time indicate daughter cells from the same parent cell.


