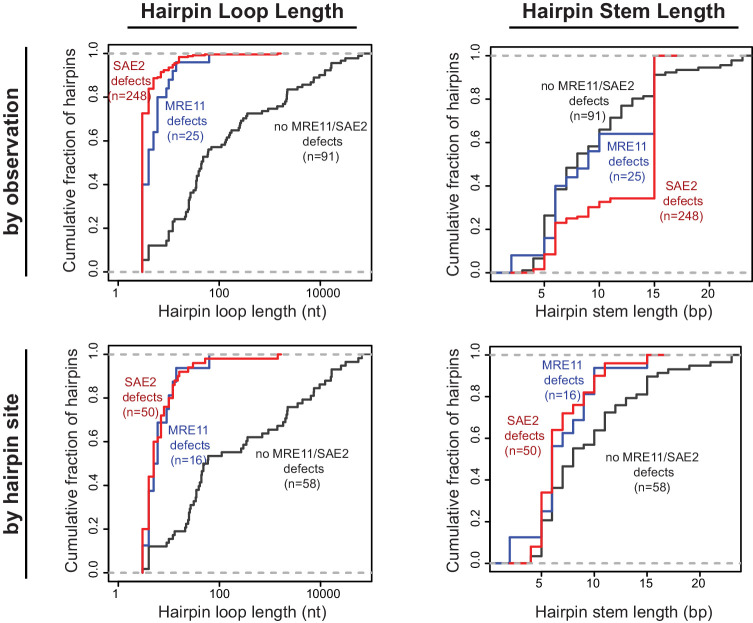
Figure 5. Distribution of the loop and stem sizes of the predicted ssDNA hairpins.
Cumulative distributions for the loop lengths (left) and hairpin stem lengths (right) for the predicted ssDNA hairpins derived from the inversion junction sequences determined. Hairpins from strains proficient for both MRE11 and SAE2 (black), deficient for MRE11 (blue), and deficient for SAE2 (red) are plotted separately. Distributions were calculated by counting each observed rearrangement once (top) and by counting each observed inversion site once (bottom). As an example of the difference between the hairpin loop sizes seen in mutants that give rise to small loop and large loop hairpins, the loop size distributions seen in sae2Δ and tel1Δ mutants are (number of occurrences in parentheses): sae2Δ - 3 nt (16), 4 nt (1), 5 nt (1), 8 nt (1), 10 nt (1); and, tel1Δ - 4 nt (1), 10 nt (4), 25 nt (1), 35 nt (2), 39 nt (1), 44 nt (1).

