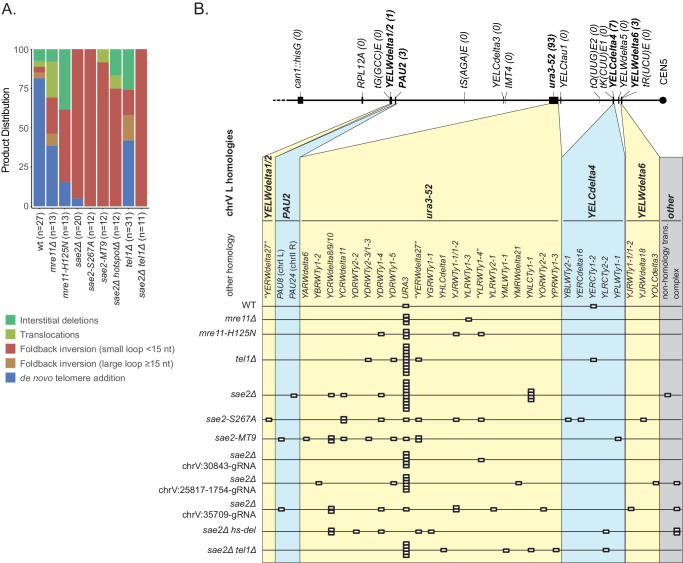
Figure 6. Analysis of the GCRs generated in MRE11, SAE2, and TEL1 mutants.
(A) Comparison of the observed GCR spectra. (B) Distribution of foldback inversion resolution products observed by genotype. Yellow and blue backgrounds distinguish homologies on chrV L involved in the rearrangement, and columns indicate homologies involved in other regions of the genome. Grey background indicates either non-homology-mediated resolution products or those involving multiple steps, ‘complex’.

