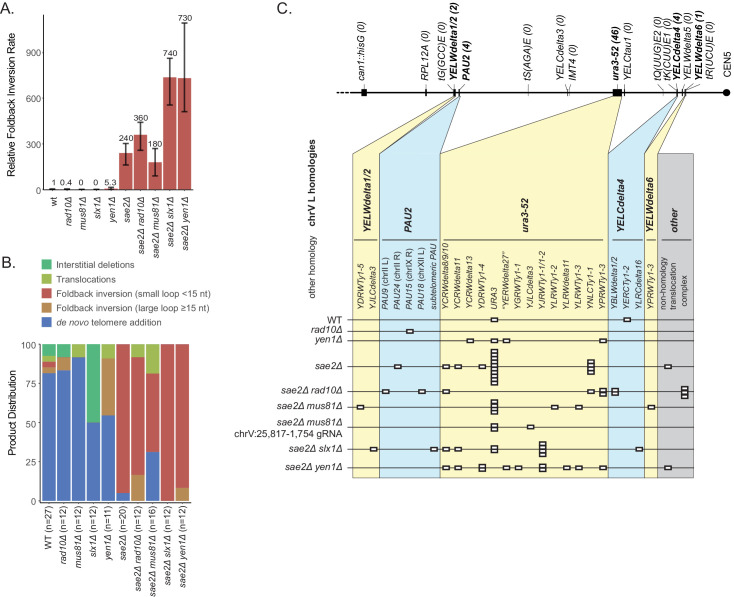
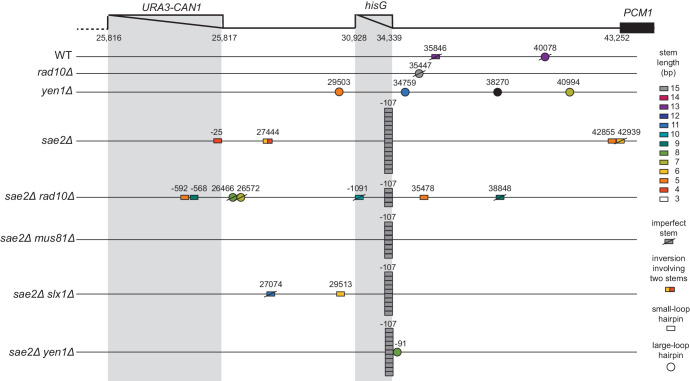
Figure 8. Analysis of GCRs generated in strains with mutations in genes encoding flap endonucleases.
(A) Comparison of the foldback inversion GCR rates relative to wild-type. (B) Comparison of the observed GCR spectra. (C) Distribution of foldback inversion resolution products observed by genotype. Yellow and blue backgrounds distinguish homologies on chrV L involved in the rearrangement, and columns indicate homologies involved in other regions of the genome. Grey background indicates either non-homology-mediated resolution products or those involving multiple steps, ‘complex’.


