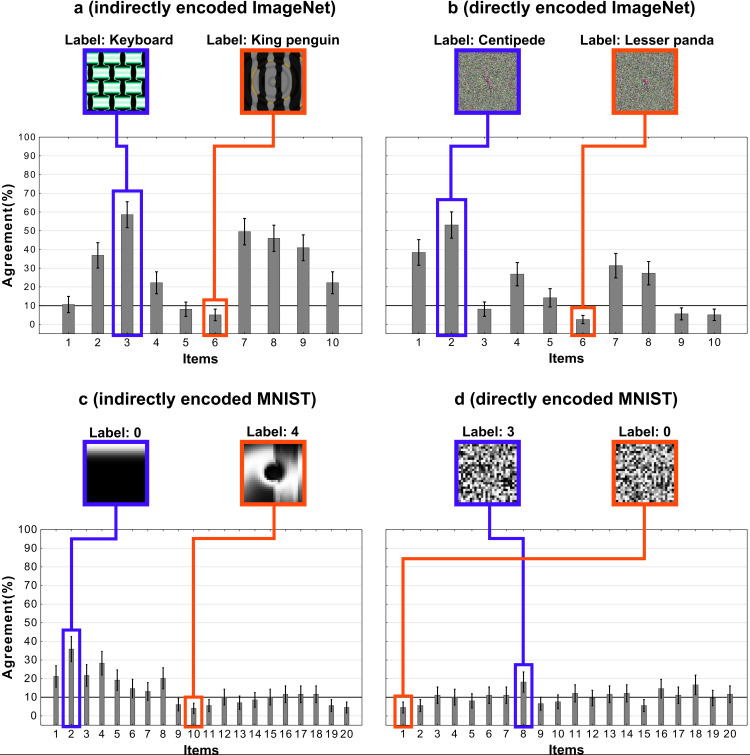
Appendix 2—figure 3. An item-wise breakdown of agreement levels for the four conditions in Experiment 3.
Each bar shows the agreement level for a particular image, that is, the percentage of participants that agreed with DCNN classification for that image. Each sub-figure also shows the images that correspond to the highest (blue) and lowest (red) levels of agreement under that condition.

