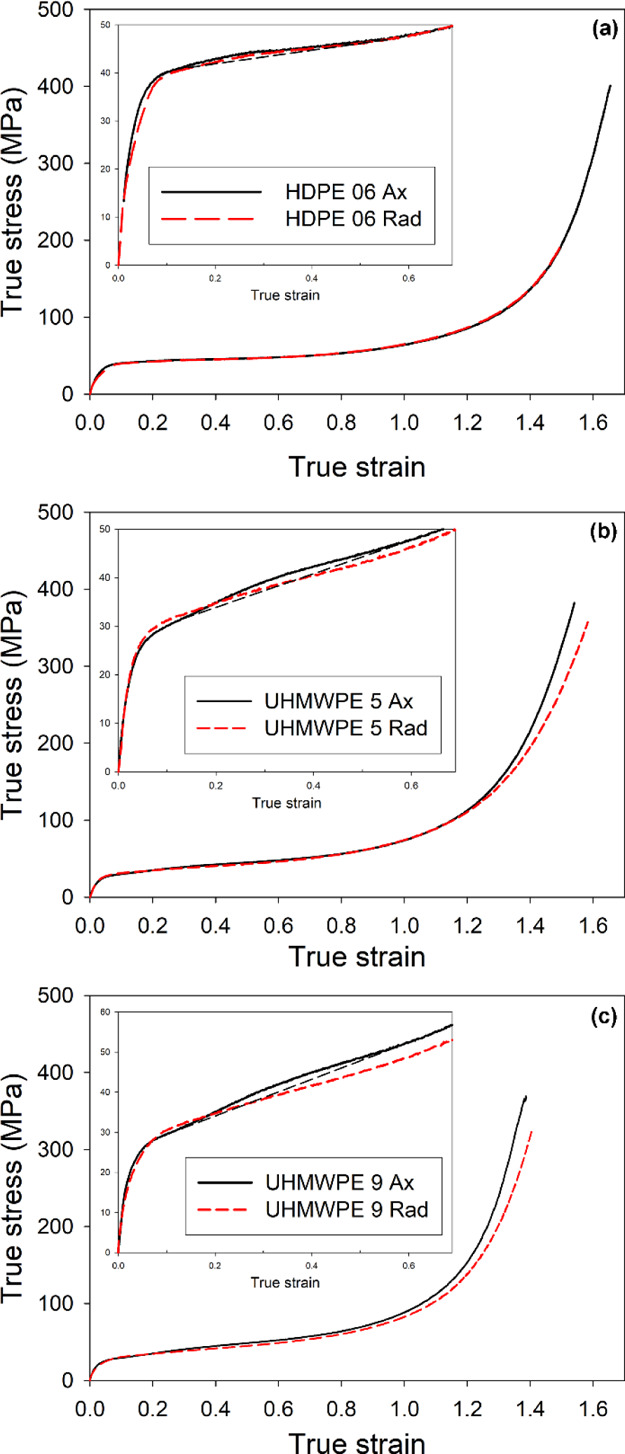
Figure 8.

True stress–true strain curves obtained by plane strain compression with the constant true compression rate of 6%/min at room temperature, compression along the D.A. (black curve) and along the D.R. (red curve) directions: (a) HDPE 06, (b) UHMWPE 5, and (c) UHMWPE 9. The insets present the initial part of the curves with elastic and yielding regions. The black-dashed lines were drawn in the inset to help to identify the humps related to the second yield in the stress–strain curves of the Ax-samples.
