
Figure 9.
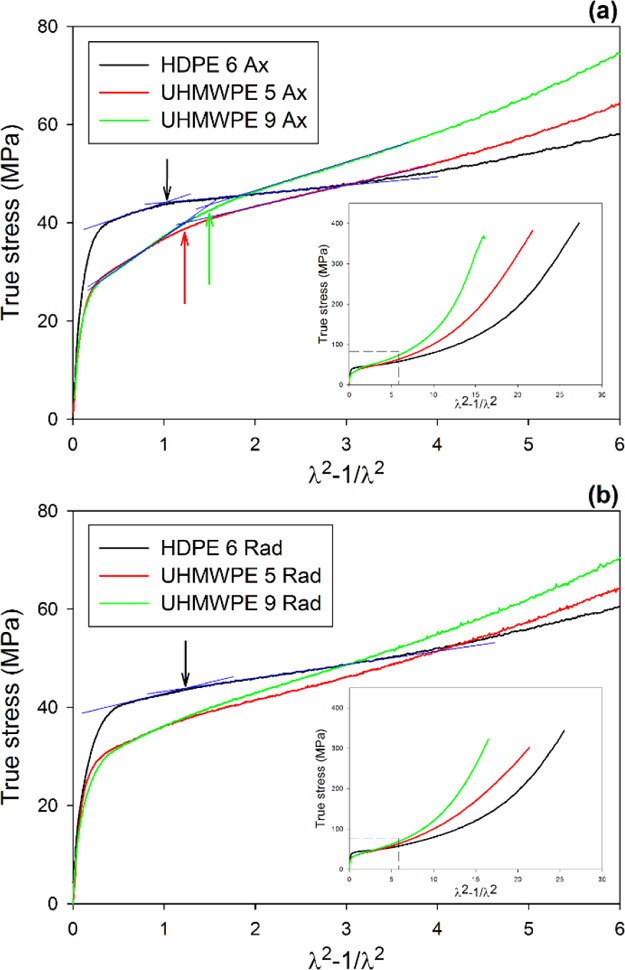
True stress plotted as a function of λ2 – 1/λ2 for Ax-samples loaded along D.A. (a) and Rad-samples loaded along D.R. (b). Arrows indicate the second yield point. Insets show the same curves in the full range of deformation.
Official websites use .gov
A
.gov website belongs to an official
government organization in the United States.
Secure .gov websites use HTTPS
A lock (
) or https:// means you've safely
connected to the .gov website. Share sensitive
information only on official, secure websites.
True stress plotted as a function of λ2 – 1/λ2 for Ax-samples loaded along D.A. (a) and Rad-samples loaded along D.R. (b). Arrows indicate the second yield point. Insets show the same curves in the full range of deformation.