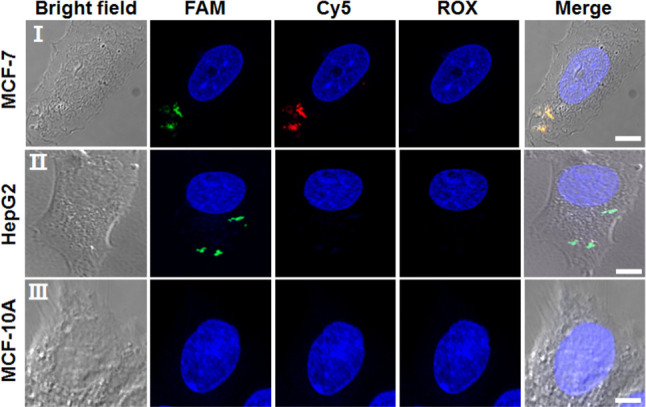
Figure 4.

Bright-field microscopy images, confocal fluorescence microscopy images, and merge images corresponding to the analysis of (entry I) MCF-7 cells, (entry II) HepG2 cells, (entry III) MCF-10A cells treated with the FAM/Cy5/ROX-functionalized tetrahedra. The fluorescence of the three fluorescent probes is imaged through three channels: FAM emission, λex = 488 nm; Cy5 emission, λex = 640 nm; ROX emission, λex = 561 nm. Scale bar: 5 μm.
