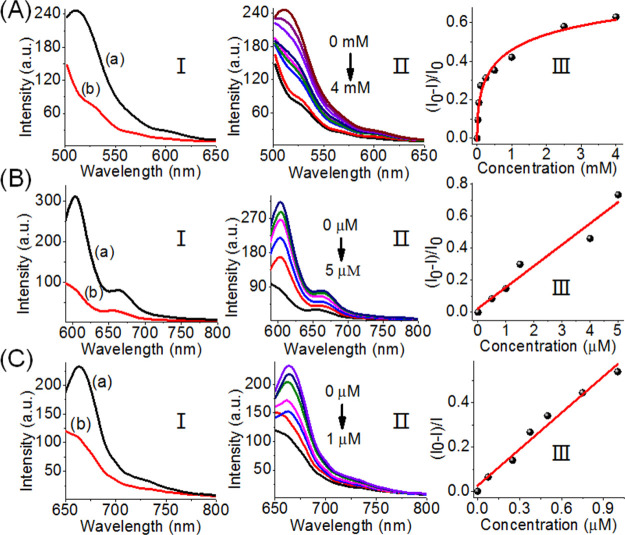
Figure 7.
Analysis of three aptamer–ligands by the DNA tetrahedron module shown in Scheme 3. (A) Sensing of ATP by the DNA tetrahedron module. Panel I: fluorescence spectra of FAM before addition of ATP (a) and after the addition of ATP, 4 mM (b). Panel II: fluorescence changes of FAM upon interaction with different concentrations of ATP. Panel III: derived calibration curve corresponding to the fluorescence changes of FAM in the presence of variable concentrations of ATP. (B) Sensing of VEGF by the DNA tetrahedron module. Panel I: fluorescence spectra of ROX before addition of VEGF (a) and after the addition of VEGF, 5 μM (b). Panel II: fluorescence changes of ROX upon interaction with different concentrations of VEGF. Panel III: derived calibration curve corresponding to the fluorescence changes of ROX in the presence of variable concentrations of VEGF. (C) Sensing of thrombin by the DNA tetrahedron module. Panel I: fluorescence spectra of Cy5 before addition of thrombin (a) and after the addition of thrombin, 1 μM (b). Panel II: fluorescence changes of Cy5 upon interaction with different concentrations of thrombin. Panel III: derived calibration curve corresponding to the fluorescence changes of Cy5 in the presence of variable concentrations of thrombin.

