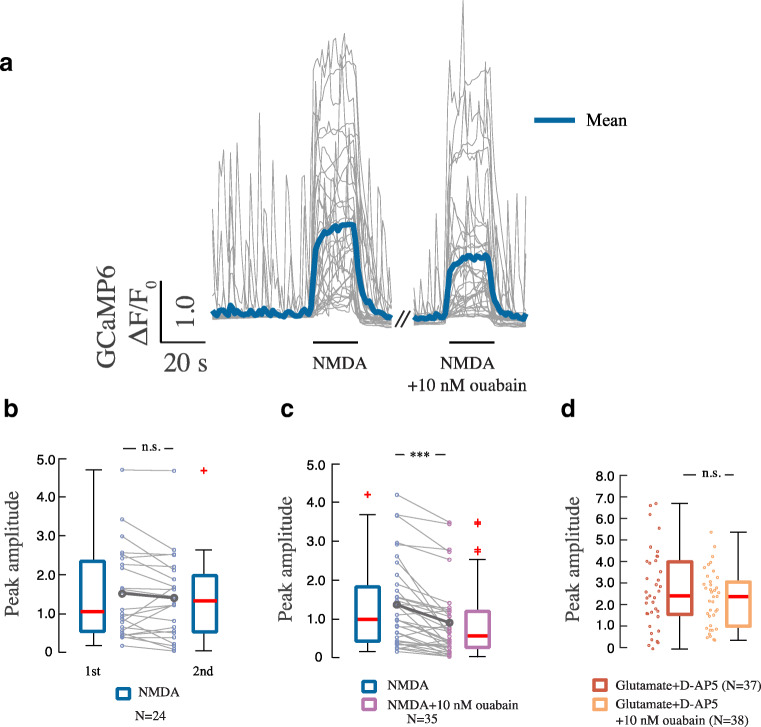
Fig. 2.
Rapid effect of nanomolar concentrations of ouabain on NMDAR-dependent calcium influx by local stimulation. a Traces of calcium responses in cells exposed to NMDA (10 μM) without and with ouabain (10 nM) for 20 s. Same concentrations apply in b and c. b Calcium response in cells exposed to subsequent 20-s pulses of NMDA. Boxplots show mean ΔF/F0 for the first and second NMDA application. c Boxplot presentation over ΔF/F0 upon stimulation with NMDA alone and respective NMDA + ouabain. n.s.—p > 0.05, ***p < 0.001, Wilcoxon signed-rank test. d Boxplot shows calcium responses during 20-s treatments with glutamate (10 μM) + D-AP5 (50 μM) and glutamate + D-AP5 + ouabain (10 nM). n.s.—p > 0.05, Wilcoxon rank sum test

