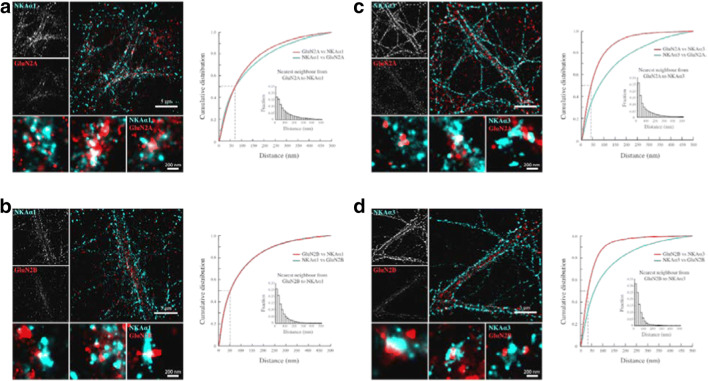
Fig. 6.
Super-resolution imaging shows that NMDAR and Na+,K + -ATPase are in close proximity in hippocampal neurons. a–d Overview images of dendritic segments from dSTORM experiments with antibody labeled GluN2-subunits (GluN2A and GluN2B) and Na,K-ATPase α-subunits (NKAα1 and NKAα3). The GluN2 antibodies were tagged with Alexa-647 conjugated secondary antibodies, and Na,K-ATPase antibodies were tagged with Atto-488 conjugated secondary antibodies. Images show Gaussian representations of clusters containing single localized molecules of dendritic segments and GluN2 subunit containing clusters. Cumulative probability distributions of quantified distances from GluN2 subunits to the closest Na,K-ATPase α and vice versa. Histogram insets show the relative frequency of distances from GluN2 subunits to the closest Na,K-ATPase α (insets). Scale bar = 5 μm (overviews of dendrites) and 200 nm (zoom in on clusters)

