Fig. 7.
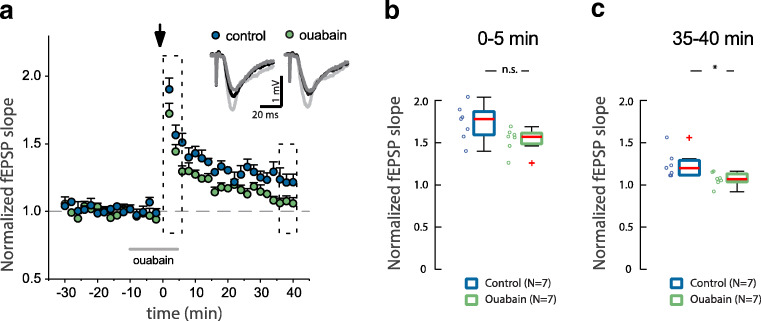
Ouabain decrease long-term potentiation in hippocampal CA3-CA1 synapses. a Time-course of changes in field EPSP (fEPSP) slopes after induction of LTP by theta-burst stimulation (arrow) in control (clear circles) and in 50 nM ouabain-treated rat hippocampal slices (filled circles). The solid gray bar denotes the time that ouabain was present in the perfused aCSF. Representative traces averaged fEPSP at baseline (dark gray) and after theta-burst stimulation (0–5 min, light gray; 55–60 min, black). b, c Bars summarizing the average changes (5 min) in fEPSP slopes after Ø-burst stimulation at the times indicated by dotted boxes in the time-course plot. n.s.—p > 0.05, *p < 0.05, Wilcoxon rank sum test

