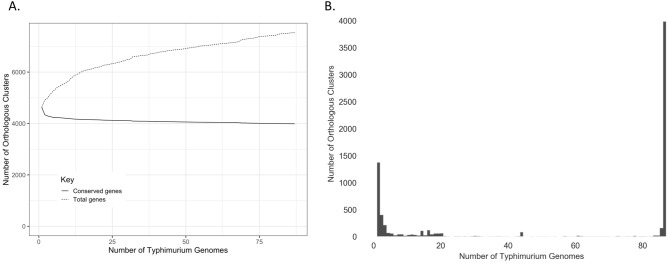
Figure 2.
Pan-genome of 87 bovine- and human-associated S. Typhimurium isolates from New York State, 1999–2016. All plots were constructed using Roary version 3.11.0 and associated scripts. Panels display (A) the number of total (dotted line) and conserved (solid line) orthologous clusters detected in all 87 isolates as genomes were added randomly (constructed using Roary’s create_pan_genome_plots.R script), and (B) the number of orthologous clusters (y-axis) detected per number of genomes (x-axis; constructed using Roary’s roary_plots.py script).

