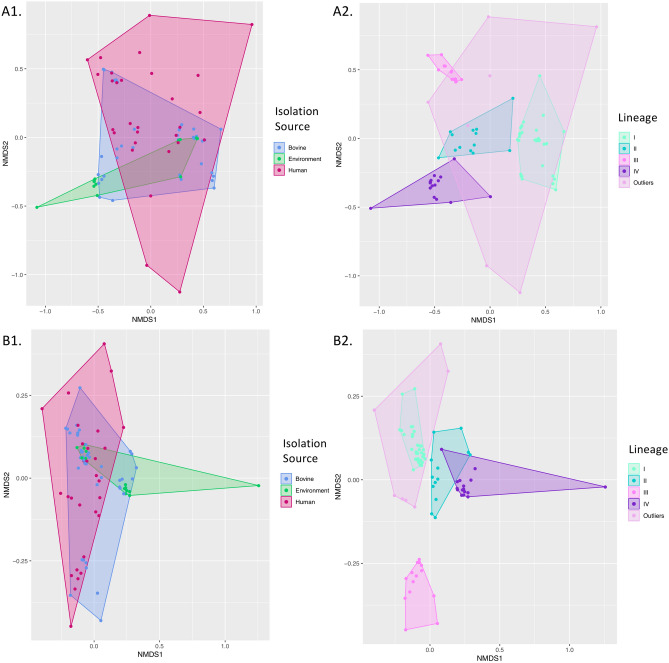
Figure 3.
Non-metric multidimensional scaling (NMDS) plots of 87 S. Typhimurium genomes constructed using a Jaccard distance metric and presence/absence profiles of (A) orthologous gene clusters output by Roary version 3.11.0 and (B) gene ontology (GO) terms. Points represent isolates, while shaded regions and convex hulls correspond to (1) isolation source (bovine, bovine farm environment, or human clinical) and (2) lineage (I–IV, and “Outliers”, which encompasses the seven human clinical genomes that were not placed into one of the four major NYS S. Typhimurium lineages).

