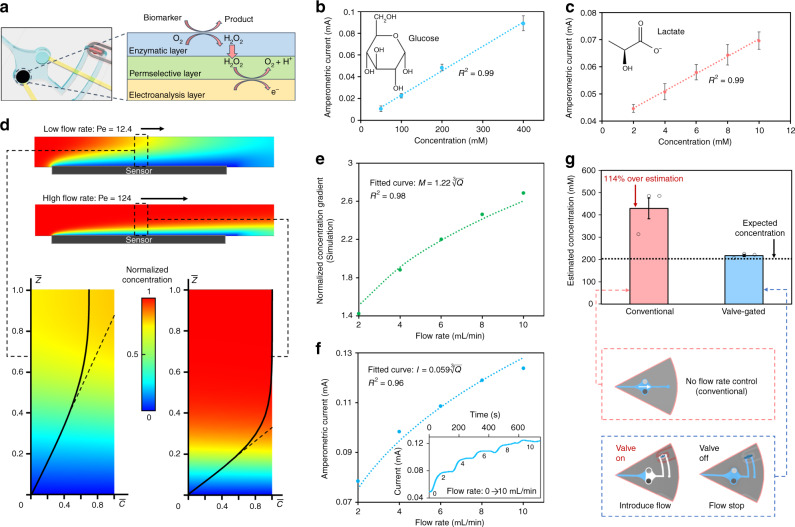
Fig. 4. Demonstration of flow rate-undistorted biomarker analysis.
a Reaction schematic of the developed sensor (embedded within a valve-gated compartment). Current response to target analytes for b a glucose sensor and c a lactate sensor. Error bars, mean ± s.e (n = 3 measurements from different sensors). d Simulated analyte concentration (gradient) profiles for relatively low and high flow rate conditions (low flow rate: Q = 1 µL min−1, resulting in Pe = 12.4, high flow rate: Q = 10 µL min−1, resulting in Pe = 124, assuming a channel transverse width of 2 mm and analyte diffusivity constant of 6.7 × 10⁻⁶ cm2 s−1). The annotated dashed lines tangent to the normalized concentration curves indicate the local analyte concentration gradient for the respective case. e Simulated local analyte concentration gradient at various flow rates (the values are normalized to that obtained for the case of 1 µL min−1). The curve fitted line indicates that simulated data points present a relationship. f Measured amperometric current response of a glucose sensor to 200 µM glucose solution introduced at various flow rates. The inset figure shows the corresponding measured real-time amperometric current response in the presence of progressively increasing flow rate (from 0 to 10 μL min−1). The curve fitted line indicates that simulated data points present a relationship. g Comparison of the estimated glucose concentration of a 200 µM glucose solution introduced at 5 µL min−1 (no valve) and 0 µL min−1 (corresponding to valve-gated condition). Error bars, mean ± s.e (n = 3 measurements from different sensors).

