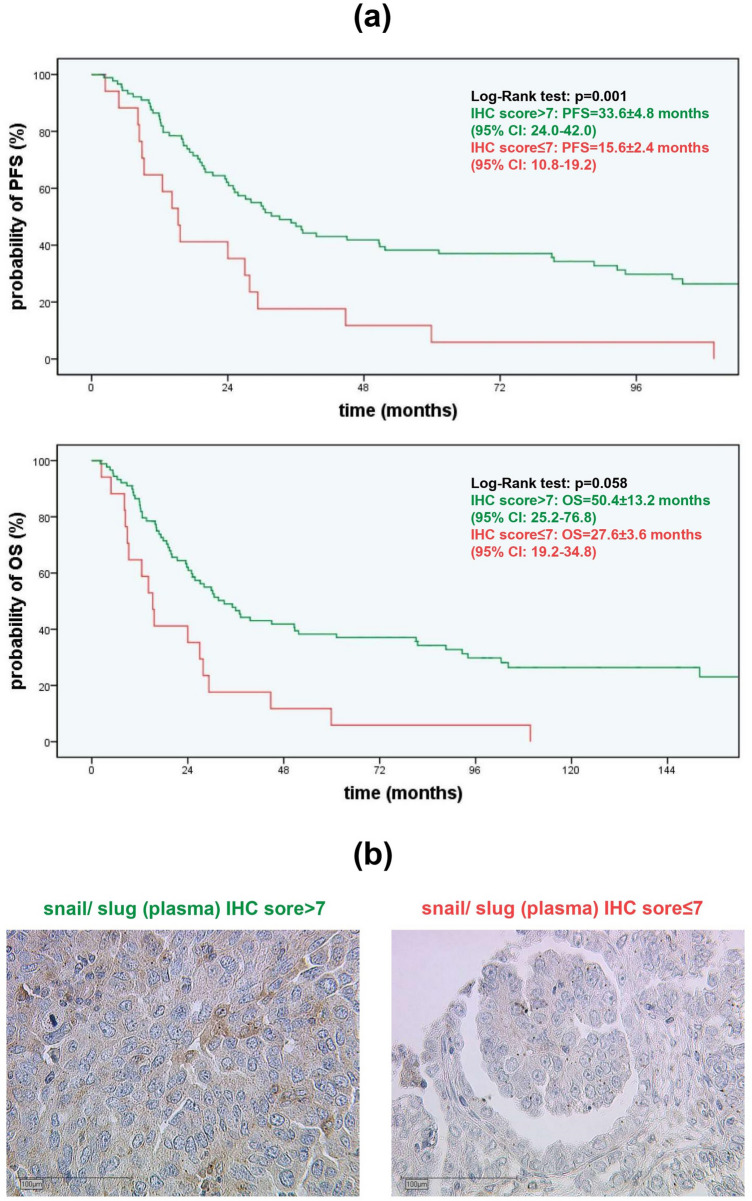
Fig. 7.
PFS depending on plasmatic snail/ slug IHC scores in serous EOC and representative microphotographies: a The Kaplan–Meier curves demonstrate PFS and OS as a function of plasmatic snail/ slug expression in serous OC cases. Green lines (IHC score > 7, PFS = 33.6 ± 4.8 months, OS = 50.4 ± 13.2 months) show a significant benefit in PFS and a trend in OS compared to the red line (IHC score ≤ 7, PFS = 15.6 ± 2.4 months, OS = 27.6 ± 3.6 months) (median ± SEM, p = 0.001/ p = 0.058 by chi-square statistic of the Log-Rank test [Mantel-Cox]). b Plasmatic snail/ slug accumulation in serous subtype is marked in brown after DAB treatment. While the left microphotography shows a higher expression (IHC score > 7), on the right photography a lower expression (IHC score ≤ 7) is shown

