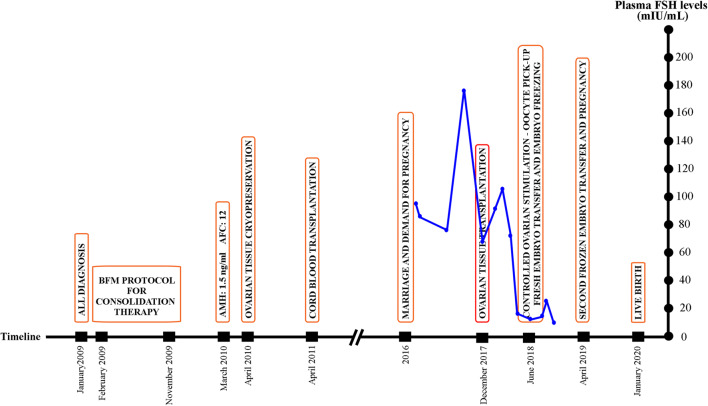
Fig. 11.
Graph of plasma FSH measurements (navy dots and lines) of the patient presented for fertility preservation from the time of referral to the pregnancy with a timeline of significant events (orange rectangles) starting from the diagnosis. The red rectangle indicates the day of ovarian transplantation

