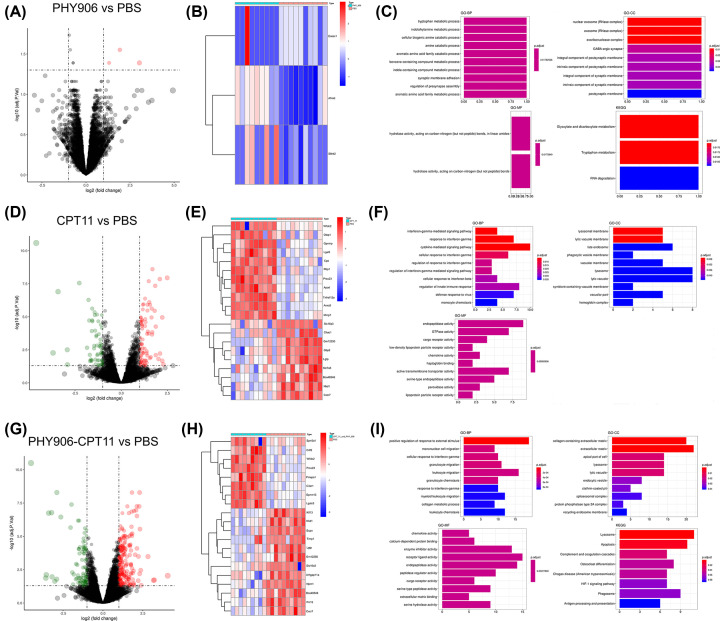
Figure 1. Analysis of DEGs in dataset GSE25192.
(A) Volcano plot and (B) heatmap of DEGs screening between PBS and PHY906. (C) GO and pathway analysis of DEGs in group of PBS vs. PHY906. (D) Volcano plot and (E) heatmap of DEGs screening between PBS and CPT11. (F) GO and pathway analysis of DEGs in group of PBS vs. CPT11. (G) Volcano plot and (H) heatmap of DEGs screening between PBS and PHY906-CPT11. (I) GO and pathway analysis of DEGs in group of PBS vs. PHY906-CPT11. Red dots indicate up-regulated genes, and green dots indicate down-regulated genes. X-axis represents the gene number and the represents the GO and KEGG terms. The color represents the −log10 (P-value) of each term.

