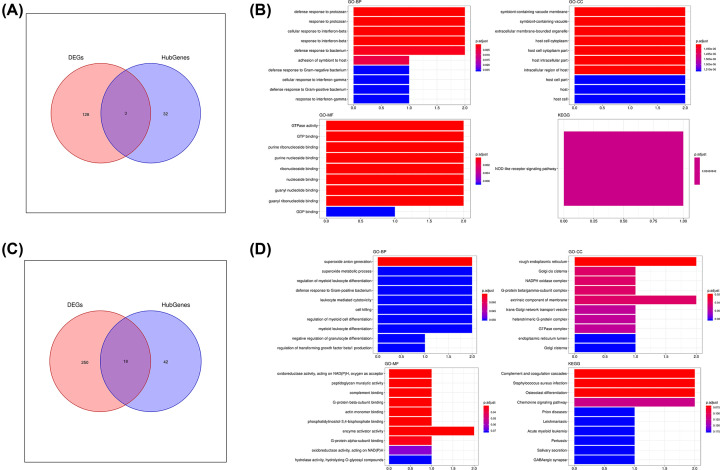
Figure 7. Identification and functional enrichment analysis of key genes.
(A) Venn plot of common genes (key genes) associated with CPT11 treatment. (B) GO and KEGG pathway analysis of key genes associated with CPT11 treatment. (C) Venn plot of common genes (key genes) associated with PHY906-CPT11 treatment. (D) GO and KEGG pathway analysis of key genes associated with PHY906-CPT11 treatment.

