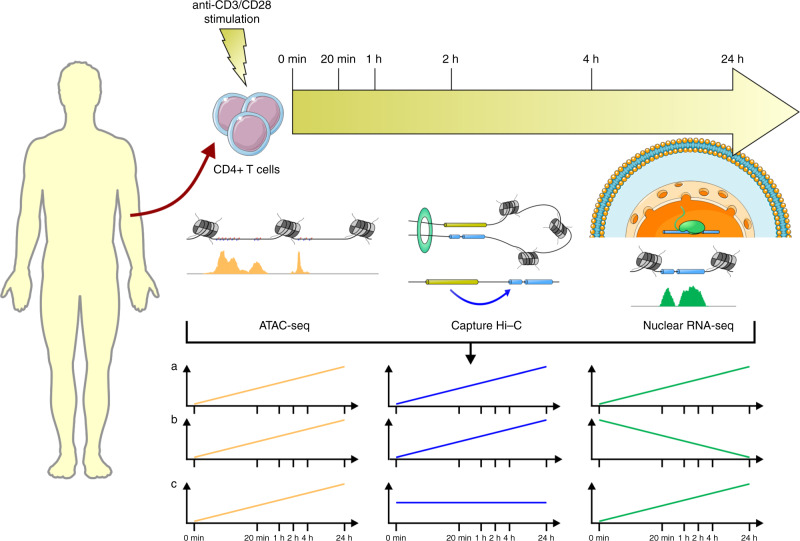
Fig. 1. Schematic of the study design.
ATAC-seq, CHi-C and nuclear RNA-seq experiments were carried out for unstimulated and stimulated CD4+ T-cell samples at time 0 min, 20 min, 1 h, 2 h, 4 h and 24 h. Time course profiles were created by aligning features (ATAC-seq peaks and CHi-C interactions) across time and counting reads supporting each feature at each time point. Courtesy of Servier Medical Art licensed under a Creative Commons Attribution 3.0 Unported license. https://smart.servier.com.

