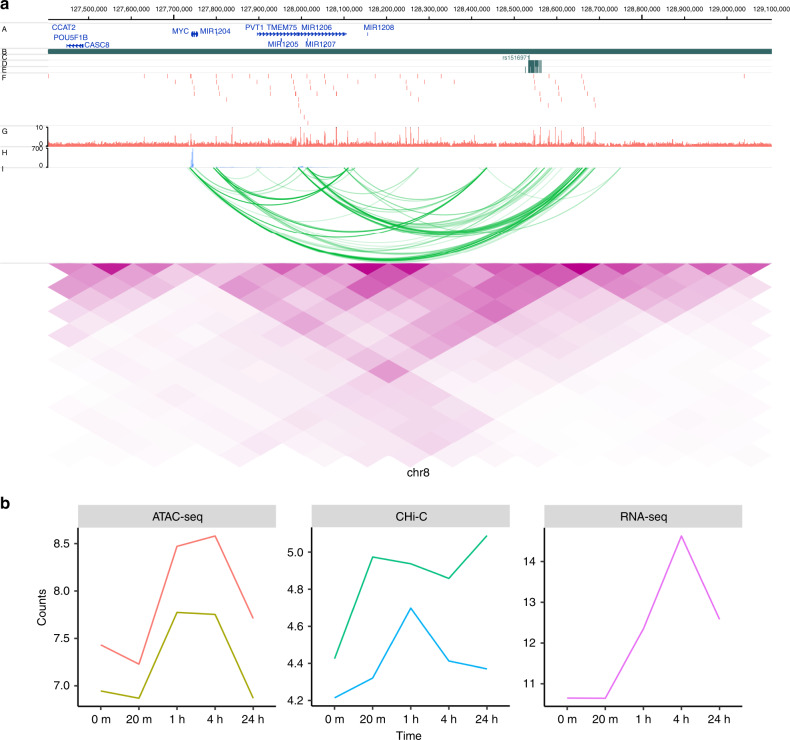
Fig. 5. Illustration of genomic interaction activities around MYC.
a Screenshot of the SNPs (dark green), ATAC-seq peaks (red), RNA-seq (lightblue), CHi-C interactions (green) and heatmap from Hi-C (purple) around MYC at time 4 h. y-axis labels A–J represent different tracks plotted. A RefSeq genes, B TADs, C Index SNPs, D LD SNPs, E 99% credible sets, F ATAC-seq peaks, G ATAC-seq signal, H RNA-seq, I CHi-C, J Hi-C. b Time course profiles of ATAC-seq (left), CHi-C (middle) and RNA-seq (right) of the data associated with SNPs data around MYC.

